Residuals vs. geschatte waarden
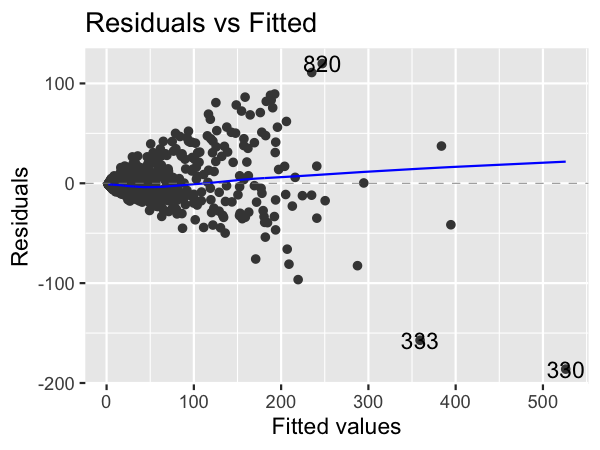
Hier zie je diagnostische grafieken van residuen versus geschatte waarden voor twee modellen over advertentieconversie.
Origineel model (n_clicks versus n_impressions)
Getransformeerd model (n_clicks ^ 0.25 versus n_impressions ^ 0.25)
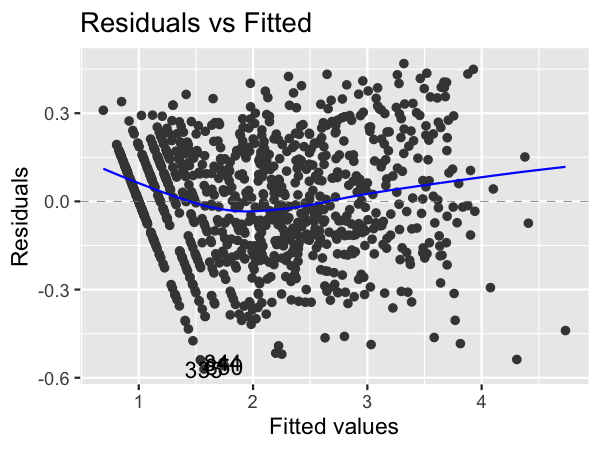
Kijk naar de getallen op de y-as en hoe goed de trendlijnen de lijn \(y = 0\) volgen. Welke uitspraak is waar?
Deze oefening maakt deel uit van de cursus
Introductie tot regressie in R
Interactieve oefening met praktijkervaring
Zet theorie om in actie met een van onze interactieve oefeningen
 Begin oefening