ACF e PACF stagionali
Qui sotto c’è una serie temporale con la stima del numero di utenti dell’acqua a Londra. A occhio non si vede un pattern stagionale evidente, ma i tuoi occhi non sono gli strumenti migliori che hai.
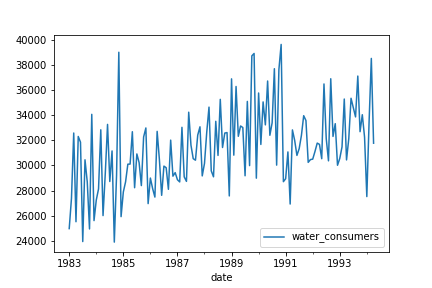
In questo esercizio userai ACF e PACF per verificare la stagionalità nei dati. Dal grafico sopra si vede che la serie non è stazionaria, quindi probabilmente dovresti rimuovere il trend. Lo farai sottraendo la media mobile. Ricorda che puoi usare una finestra di qualsiasi valore maggiore del probabile periodo.
La funzione plot_acf() è stata importata e la serie temporale è stata caricata come water.
Questo esercizio fa parte del corso
Modelli ARIMA in Python
esercizio interattivo pratico
Prova questo esercizio completando questo codice di esempio.
# Create figure and subplot
fig, ax1 = plt.subplots()

# Plot the ACF on ax1
plot_acf(____, ____, zero=False,  ax=ax1)

# Show figure
plt.show()