Interpréter un dendrogramme
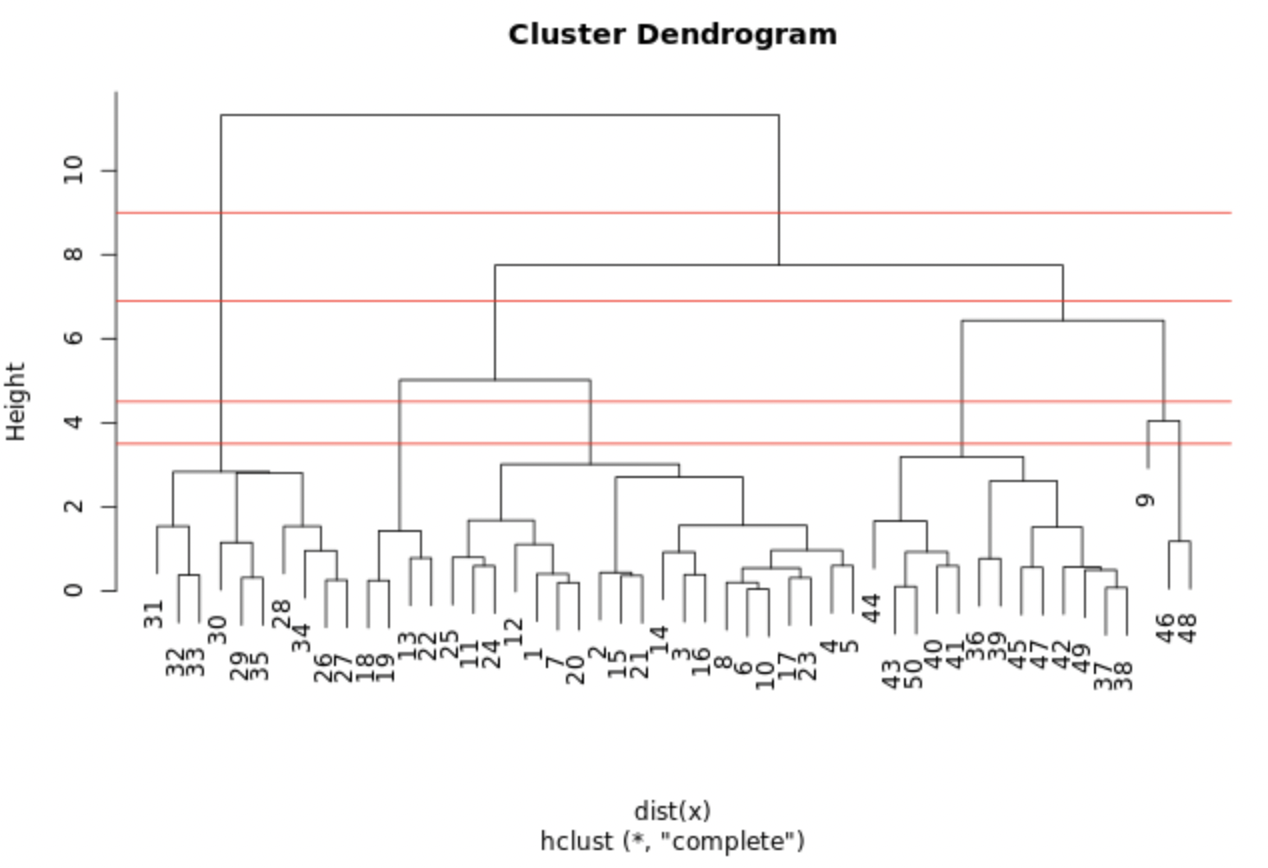
Le graphique affiché montre le modèle hclust.out que vous avez construit dans l’exercice précédent. Nous avons tracé des lignes horizontales aux hauteurs 3,5, 4,5, 6,9 et 9,0.
Quel point de coupe donne 3 clusters ?
Cet exercice fait partie du cours
<cours>Apprentissage non supervisé en R</cours>Exercice interactif pratique
Transformez la théorie en action avec l’un de nos exercices interactifs
 Commencer l’exercice