Atombomben pro Land
Du hast eine Version der Nuclear Explosion DataBase (NEDB) erhalten, in der die Ländernamen in den Spaltenüberschriften stehen (nuke_df). Du möchtest visualisieren, wie viele Atombomben pro Jahr und pro Land gezündet wurden. Dafür musst du die Daten erst pivotieren und NA-Werte ersetzen.
Das Paket ggplot2 wurde bereits für dich geladen.
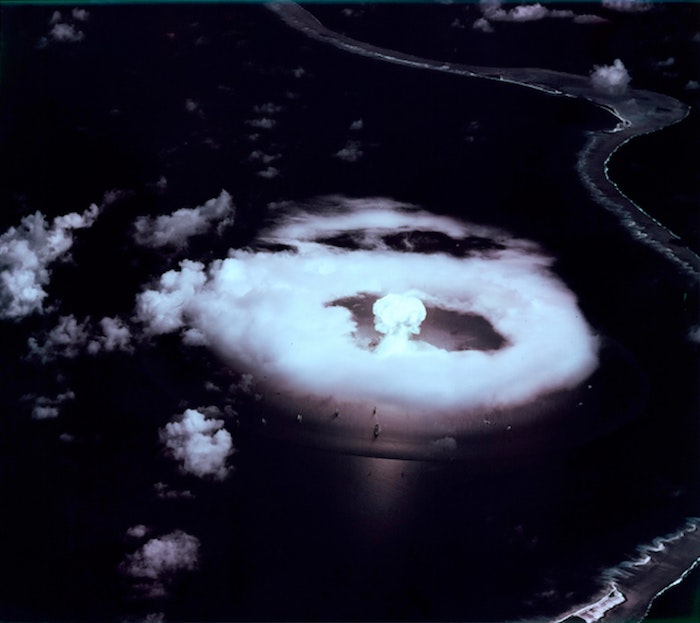
„A-Day“ Erste Atombombenexplosion bei Bikini auf den Marshallinseln am 1. Juli 1946.
Diese Übung ist Teil des Kurses
<Kurs>Daten umformen mit tidyr</Kurs>Interaktive praktische Übung
Versuche dich an dieser Übung, indem du diesen Beispielcode vervollständigst.
nuke_df %>%
  # Pivot the data to a longer format
  ___