Die Variable Alter untersuchen
Eine gängige Methode, eine Variable zu untersuchen, ist zu zählen, wie oft bestimmte Werte in den Daten vorkommen.
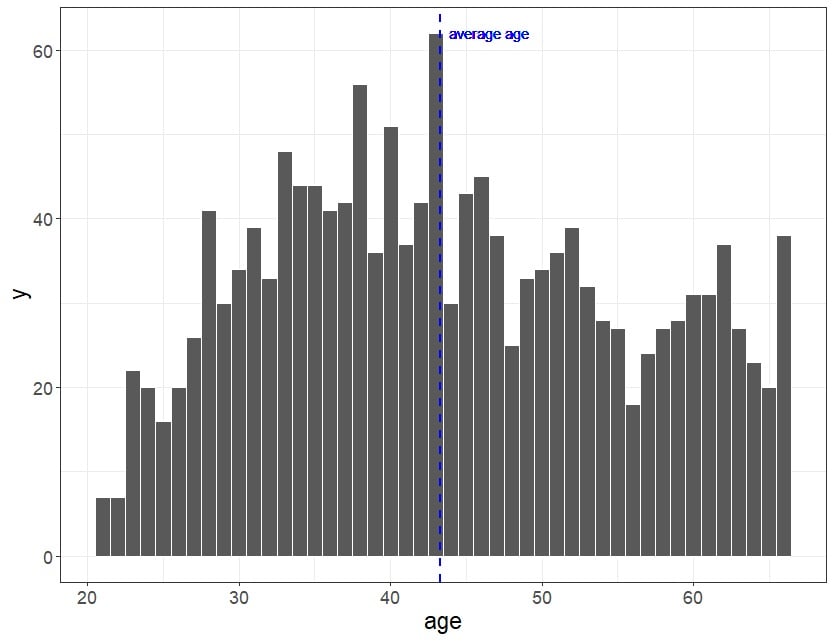
Ein Histogramm zeigt zum Beispiel die Häufigkeiten für jeden Variablenwert. Das hilft sehr dabei zu prüfen, welche Werte am häufigsten sind oder welche fehlen.
Die Data Scientist in deinem Team hat das hier gezeigte Histogramm vorbereitet, um dir zu helfen einzuschätzen, wie gut verschiedene Altersgruppen in der Umfrage vertreten sind.
 Welche Aussagen über das Alter sind WAHR?
Diese Übung ist Teil des Kurses
<Kurs>Fallstudie zur Data Literacy: Analyse von Remote-Arbeit</Kurs>Interaktive praktische Übung
Verwandle Theorie mit einer unserer interaktiven Übungen in die Praxis
 Übung starten