Daten für ein Facet-Grid-Diagramm vorbereiten
In dieser Übung wirst du die Daten vorbereiten, um dieses Diagramm zu erstellen:
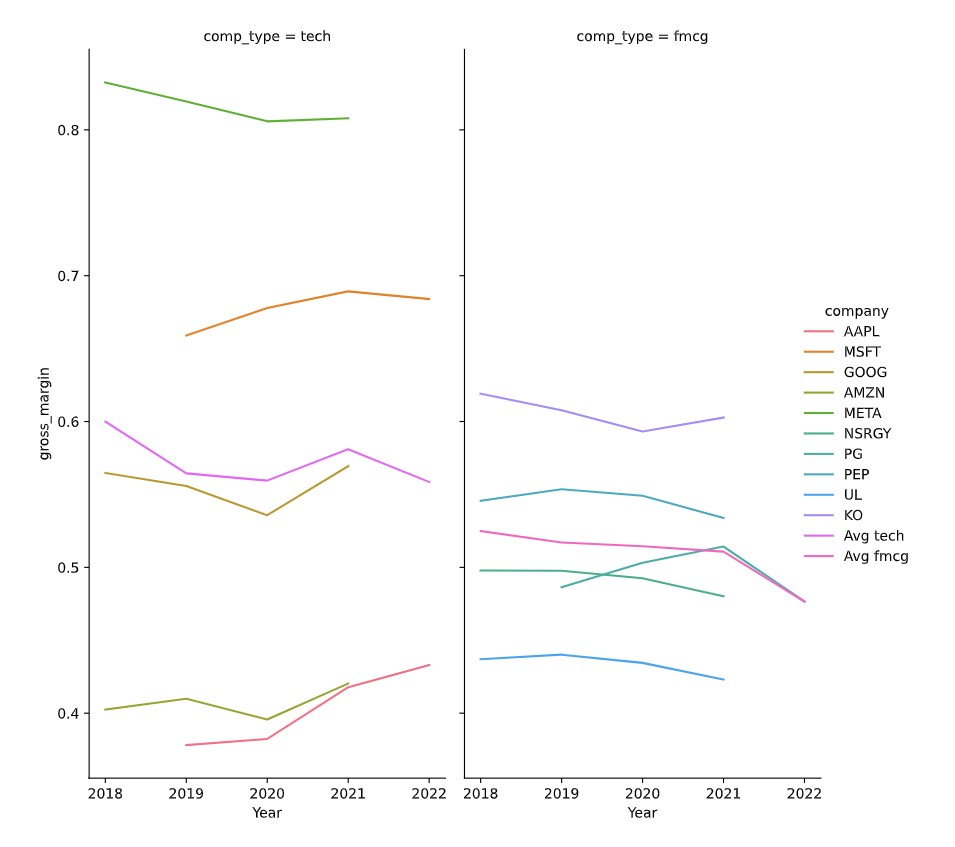 In der nächsten Übung übst du, das Diagramm zu erstellen. Dieses Diagramm eignet sich gut, um Folgendes zu beobachten:
- Die Bruttomarge von Tech-Unternehmen ist stärker gestreut als die von FMCG-Unternehmen.
- Jahr für Jahr, wie profitabel ein Unternehmen im Vergleich zum Durchschnitt seines Sektors ist.
pandas ist mit dem Alias pd geladen und seaborn mit dem Alias sns. Ein pandas DataFrame dataset ist für dich geladen, das bereits eine berechnete Spalte gross_margin enthält.
Diese Übung ist Teil des Kurses
<Kurs>Finanzberichte mit Python analysieren</Kurs>Interaktive praktische Übung
Versuche dich an dieser Übung, indem du diesen Beispielcode vervollständigst.
# Subset tech and fmcg companies
subset_dat = dataset.loc[____]