Interpretace dendrogramu
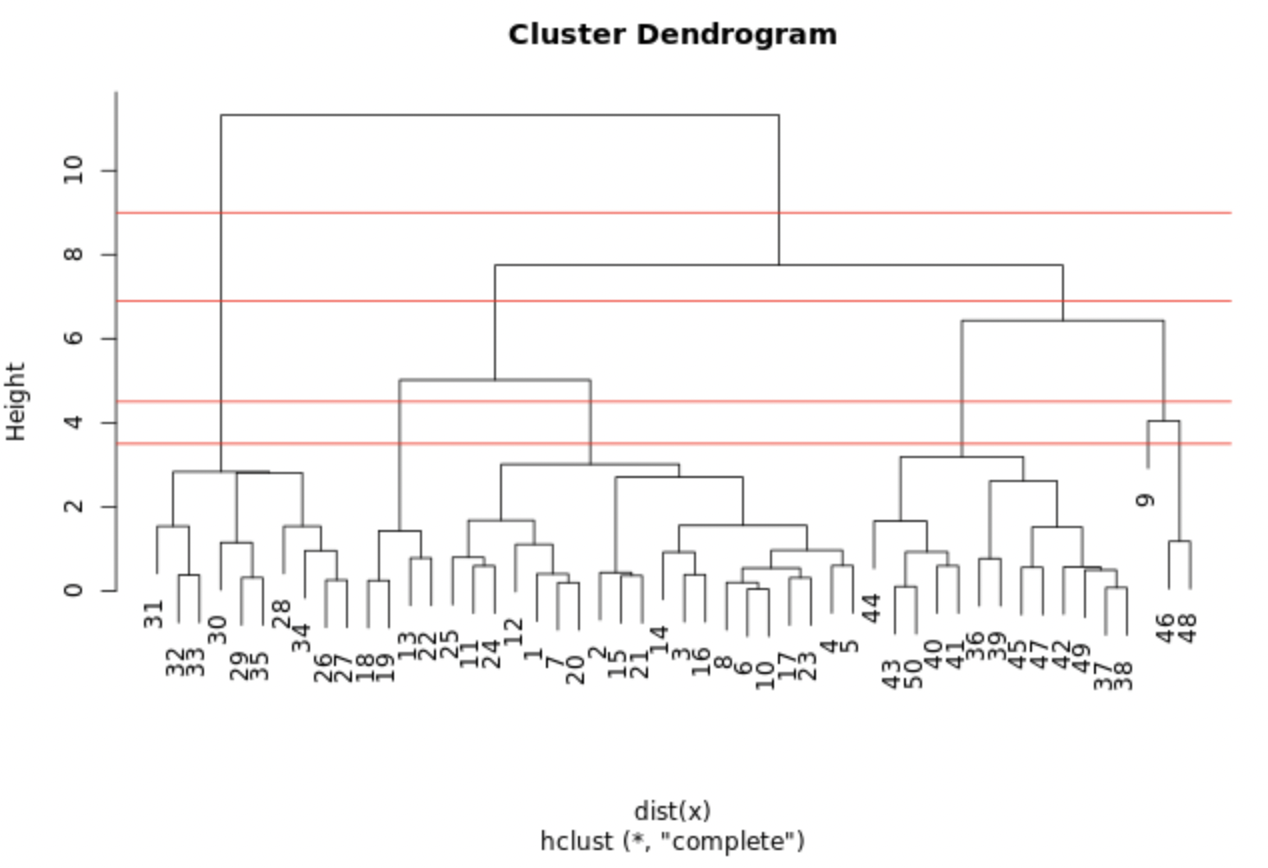
Graf zobrazuje model hclust.out, který jsi sestavil/a v předchozím cvičení. Zakreslili jsme do něj vodorovné čáry ve výškách 3,5, 4,5, 6,9 a 9,0.
Který řez vytvoří 3 shluky?
Toto cvičení je součástí kurzu
Unsupervised Learning in R
Interaktivní praktické cvičení
Proměňte teorii v praxi s jedním z našich interaktivních cvičení
 Začít cvičení