Hierarchical heatmap analysis
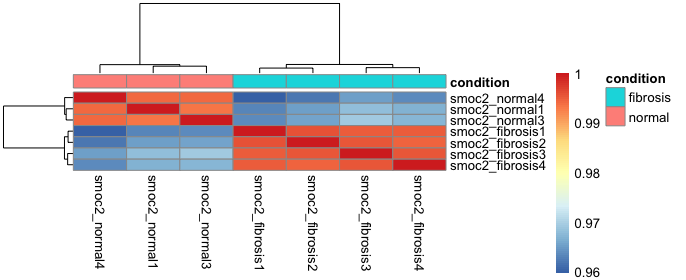
Based on the heatmap created during the previous exercise (shown below), choose the answer that best describes the plot.
This exercise is part of the course
RNA-Seq with Bioconductor in R
Hands-on interactive exercise
Turn theory into action with one of our interactive exercises
 Start Exercise