Whole life insurance
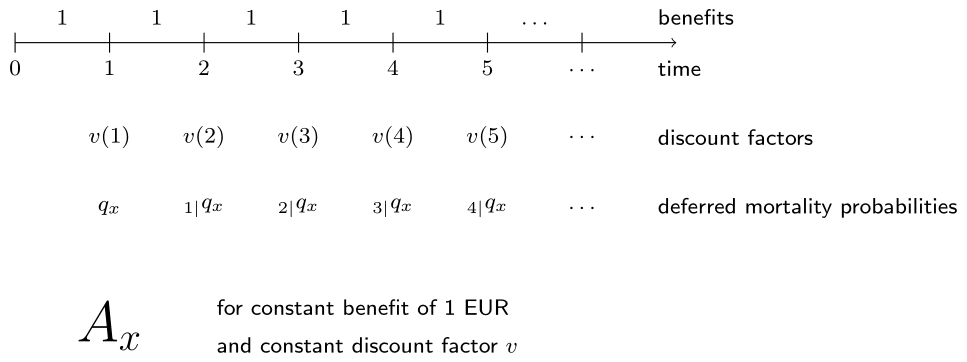
To help out her friend Ethan who is studying for the actuarial exam, Cynthia wants to build him some R code that calculates the EPV of a (whole) life insurance on \((x)\) for a given constant interest rate \(i\). Since the death benefits are constant at 1 EUR, you don't need to explicitly take them into account in the calculations.
The 1999 Belgian female life table is preloaded as life_table. The functions plot_by_age() and plot_by_interest_rate() have been predefined to illustrate how the EPV varies with the age \(x\) of the policyholder and with the interest rate. You can inspect these functions by typing their name in the R console.
This exercise is part of the course
Life Insurance Products Valuation in R
Exercise instructions
- Complete the function
whole_life_insurance()which calculates the EPV of a whole life insurance for givenage, interest rateiandlife_table. - Run the predefined code to plot the EPV of a whole life insurance for a range of ages (at interest rate 3%) and a range of interest rates (for a 20-year-old). Interpret the resulting graphs.
Hands-on interactive exercise
Have a go at this exercise by completing this sample code.
# Function to compute the EPV of a whole life insurance
whole_life_insurance <- function(age, i, life_table) {
  qx <- life_table$qx
  px <- ___
  kpx <- c(1, cumprod(px[(___):(length(px) - 1)]))
  kqx <- kpx * qx[(___):length(qx)]
  discount_factors <- (___) ^ - (1:length(kqx))
  sum(discount_factors * kqx)
}

# Plot the EPV of a whole life insurance for a range of ages at interest rate 3% using life_table
plot_by_age()

# Plot the EPV of a whole life insurance for (20) for a range of interest rates using life_table
plot_by_interest_rate()