為分面網格圖準備資料
在這個練習中,你會先準備資料來製作下圖:
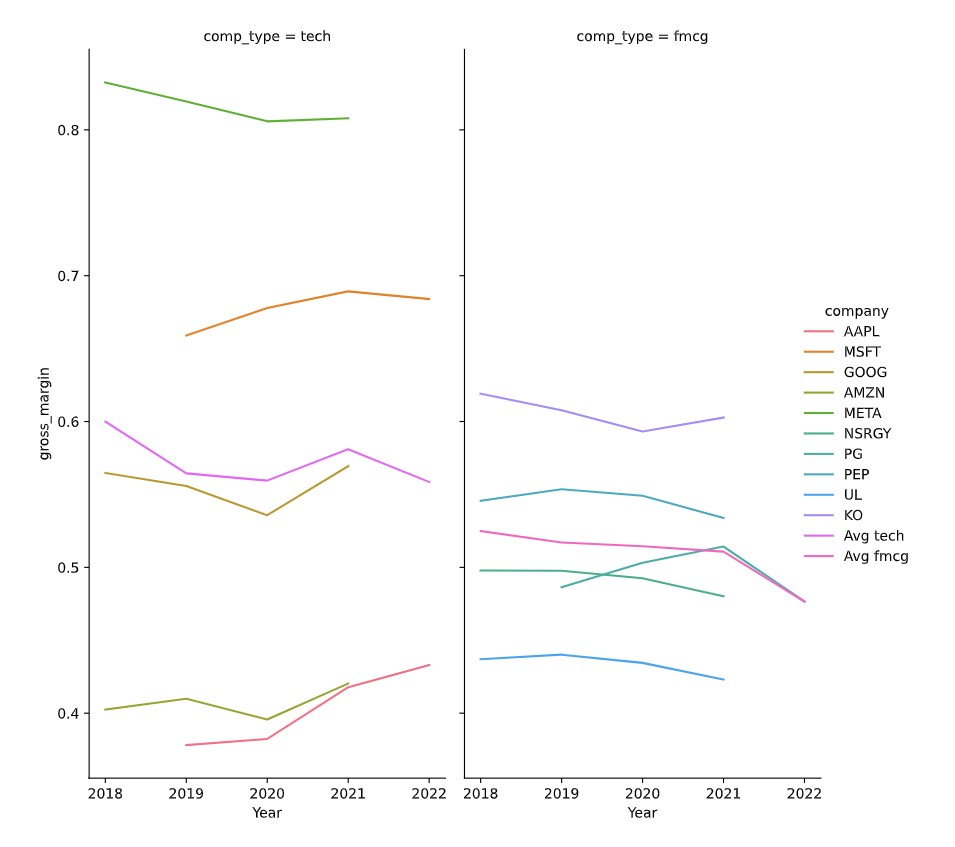 在下一個練習,你將實作繪圖。這張圖可以清楚觀察到:
- 科技公司的毛利率分佈比 FMCG 公司更分散。
- 每年各家公司相較於其產業平均的獲利能力。
pandas 已以別名 pd 載入,seaborn 已以別名 sns 載入。已為你載入一個 pandas 的 DataFrame dataset,其中已計算好 gross_margin 欄位。
本練習屬於課程
在這個練習中,你會先準備資料來製作下圖:
在下一個練習,你將實作繪圖。這張圖可以清楚觀察到:
pandas 已以別名 pd 載入,seaborn 已以別名 sns 載入。已為你載入一個 pandas 的 DataFrame dataset,其中已計算好 gross_margin 欄位。
本練習屬於課程