Normal dağılımı tanımak
Normal dağılım gerçek hayatta sıkça karşımıza çıkar; örneğin ayakkabı numarası, yetişkin boyu, bebeklerin doğum ağırlığı ve IQ puanları. Bu yüzden veriyi görselleştirirken bu dağılımı tanıyabilmek önemlidir.
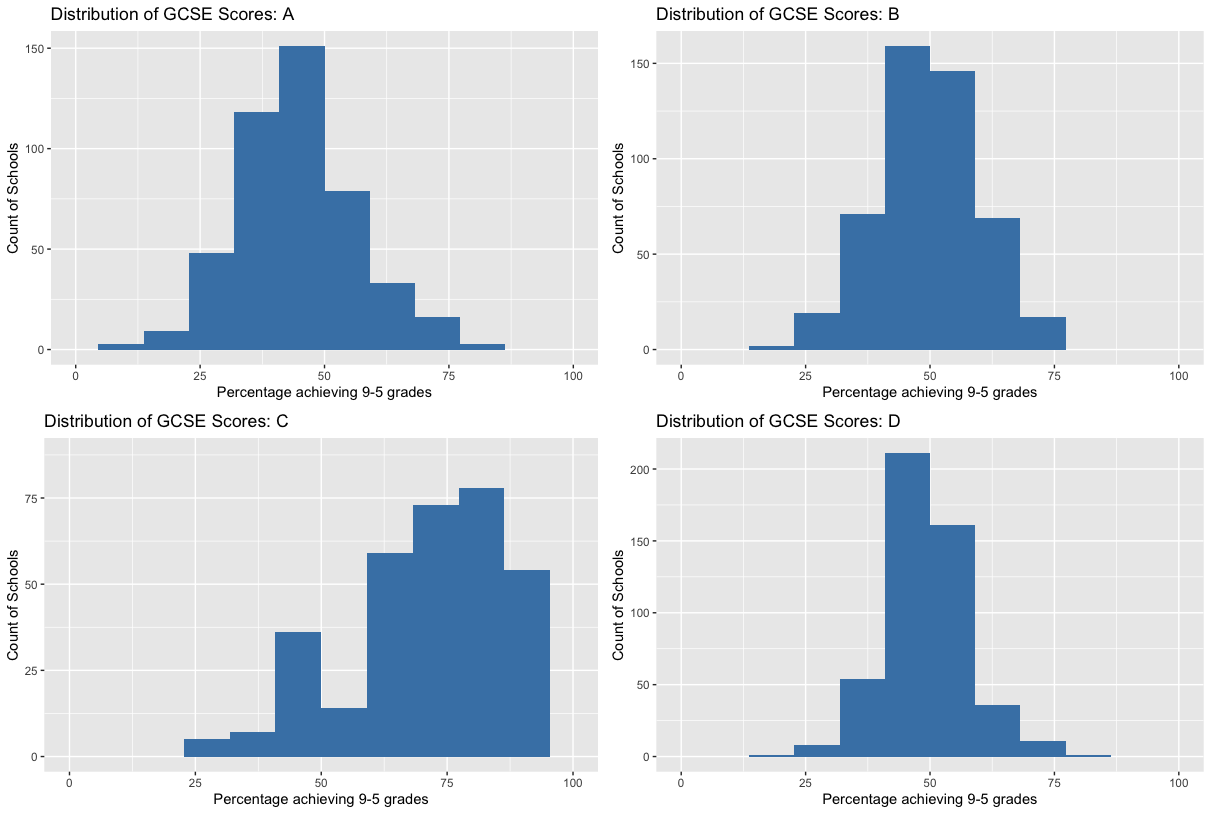
Aşağıda, Birleşik Krallık'taki ortaöğretim sınavlarında çeşitli yüzdelerde geçme notu elde eden okulların dağılımını gösteren dört grafik yer alıyor; her görselleştirme farklı bir etnik gruptaki öğrencileri temsil ediyor.
Görevin, bu grafiklerden hangisinin normal dağılımı temsil etmediğini belirlemek.
Bu egzersiz
İstatistiklere Giriş
kursunun bir parçasıdırUygulamalı interaktif egzersiz
İnteraktif egzersizlerimizden biriyle teoriyi pratiğe dökün
 Egzersizi başlat