Korelasyon sana ne söyleyebilir?
Son egzersizde, farklı şehirlerde bir şişe suyun maliyeti ile yıllık çalışılan saat sayısı arasında zayıf-orta düzeyde negatif bir ilişki görmüştün. İşte hatırlatma için grafik:
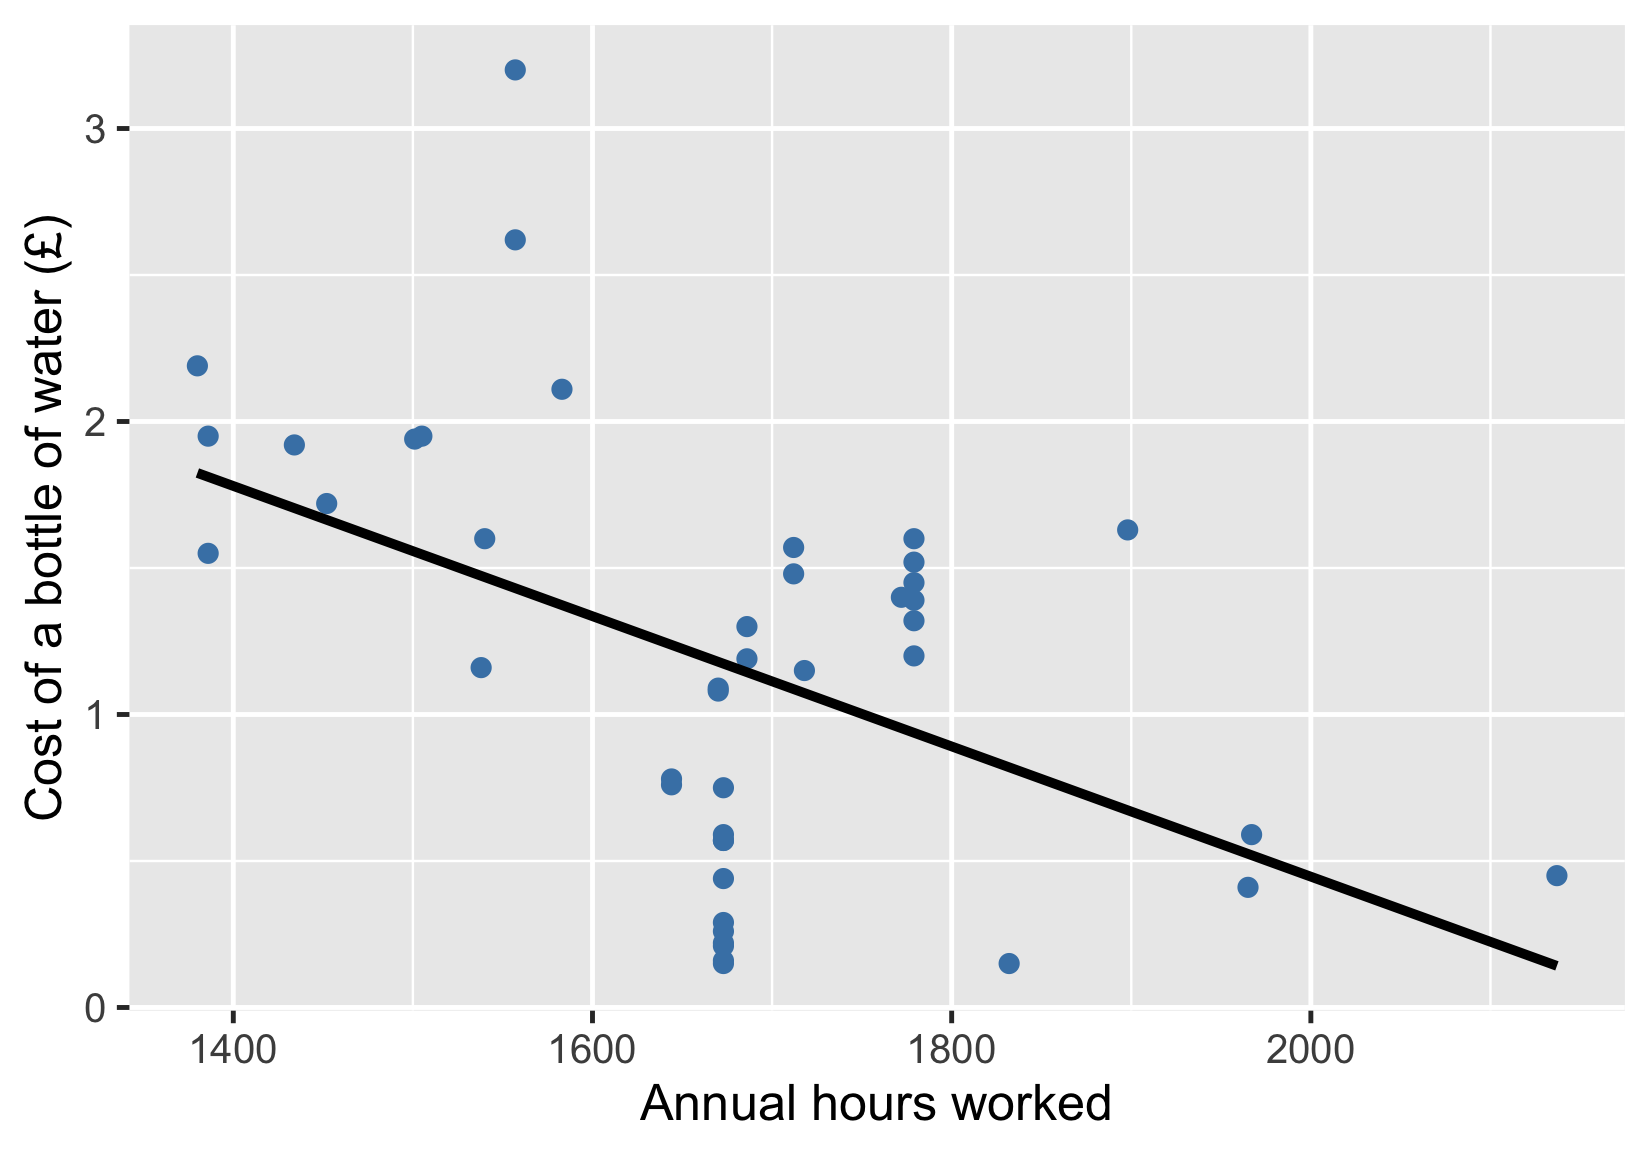
Görevin, bu görselleştirmeden makul şekilde çıkarabileceğin sonucu doğru biçimde anlatan ifadeyi seçmek.
Bu egzersiz, kursun bir parçasıdır
İstatistiklere Giriş
Uygulamalı etkileşimli egzersiz
Teoriyi etkileşime dönüştürün, interaktif egzersizlerimizden biriyle
 Egzersize başla