Crearea unui grafic de tip facet grid
În exercițiul anterior, ai scris următorul cod:
# Subset tech and fmcg companies
subset_dat = dataset.loc[dataset["comp_type"].isin(["tech", "fmcg"])]

# Compute yearly average gross margin ratio of tech and fmcg companies
subset_dat_avg = subset_dat.pivot_table(index=["Year", "comp_type"], values = "gross_margin").reset_index()

#Add column company
subset_dat_avg["company"] = np.where(subset_dat_avg["comp_type"]=="tech", "Avg tech", "Avg fmcg")

#Concat the DataFrames
plot_df = pd.concat([subset_dat, subset_dat_avg], axis=0)
Codul a pregătit datele pentru a genera următorul grafic:
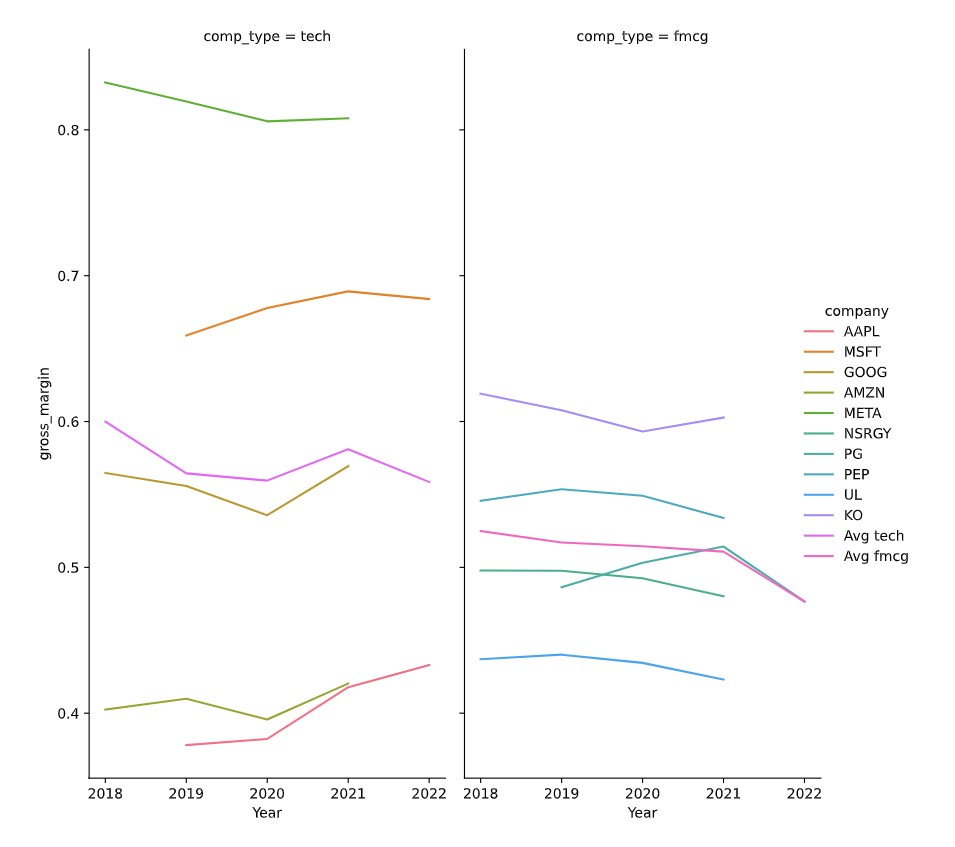
Acum e momentul să creezi graficul.
Acest exercițiu face parte din cursul
Analiza situațiilor financiare în Python
Instrucțiuni pentru exercițiu
- Folosește DataFrame-ul
plot_dfpentru a crea graficul de tip facet grid descris mai sus, utilizândseaborn.
Exercițiu interactiv practic
Încearcă acest exercițiu completând acest cod de exemplu.
# Make the plot
sns.relplot(data=plot_df.reset_index(drop=True), ____)
plt.show()
plt.close()