Pregătirea datelor pentru un grafic facet grid
În acest exercițiu, vei pregăti datele pentru a crea acest grafic:
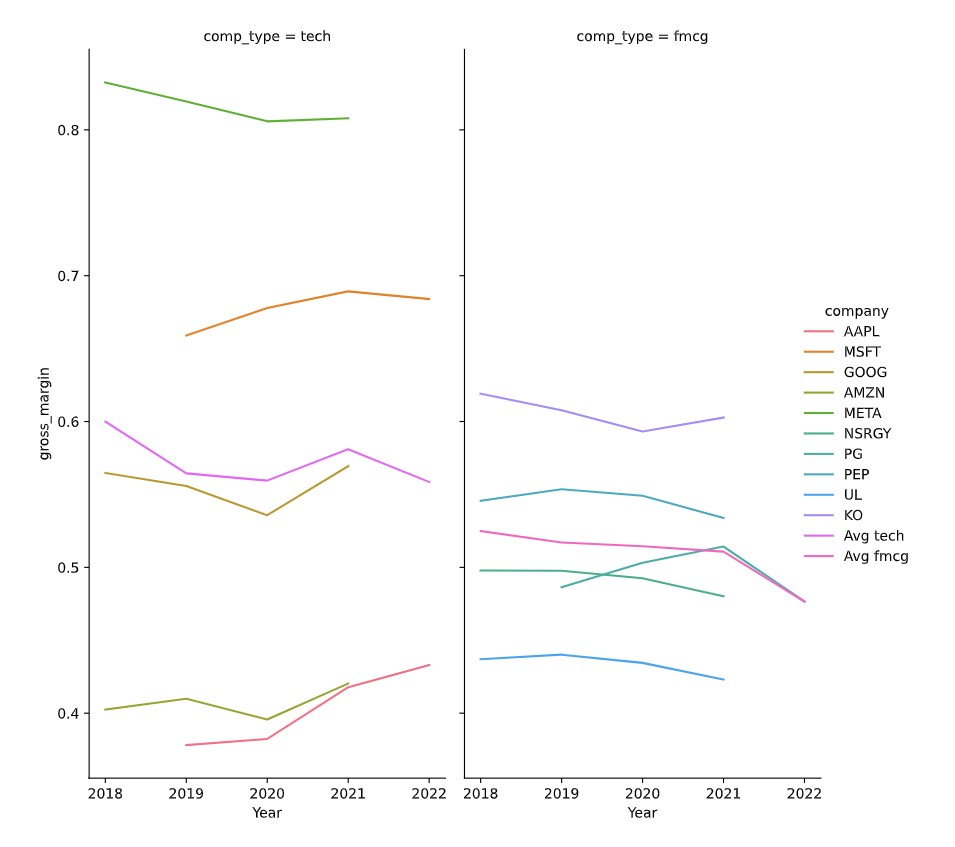 În exercițiul următor, vei exersa crearea graficului. Este un grafic foarte util pentru a observa:
- Marja brută a companiilor tech este mai răspândită decât cea a companiilor FMCG
- An de an, cât de profitabilă este o companie față de media companiilor din industria sa.
pandas este încărcat cu aliasul pd, iar seaborn este încărcat cu aliasul sns. Un DataFrame pandas numit dataset este deja încărcat și conține o coloană gross_margin calculată.
Acest exercițiu face parte din cursul
Analiza situațiilor financiare în Python
Exercițiu interactiv practic
Încearcă acest exercițiu completând acest cod de exemplu.
# Subset tech and fmcg companies
subset_dat = dataset.loc[____]