De verkeersbordgegevens verkennen
Om beter te begrijpen hoe de functie knn() het stopbord kon classificeren, helpt het om de trainingsgegevens te bekijken die hiervoor zijn gebruikt.
Elk eerder waargenomen verkeersbord is opgedeeld in een 4x4-raster, en het rood-, groen- en blauwniveau van elk van de 16 middelste pixels is vastgelegd, zoals hier geïllustreerd.
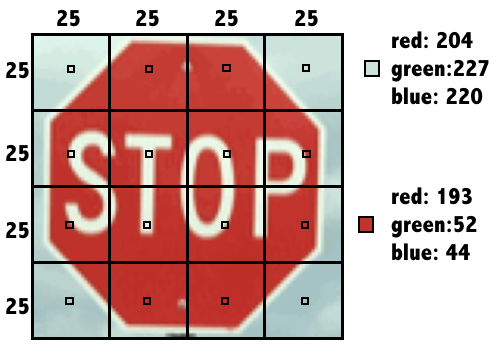
Het resultaat is een gegevensset die het sign_type registreert, plus 16 x 3 = 48 kleurkenmerken van elk bord.
Deze oefening maakt deel uit van de cursus
Supervised Learning in R: Classificatie
Oefeninstructies
- Gebruik de functie
str()om designs-gegevensset te bekijken. - Gebruik
table()om het aantal observaties per bordtype te tellen door de kolom met de labels door te geven. - Voer het meegeleverde
aggregate()-commando uit om te zien of het gemiddelde roodniveau kan verschillen per bordtype.
Interactieve oefening met praktijkervaring
Probeer deze oefening door deze voorbeeldcode aan te vullen.
# Examine the structure of the signs dataset


# Count the number of signs of each type
table(___)

# Check r10's average red level by sign type
aggregate(r10 ~ sign_type, data = signs, mean)