Relevante drifts identificeren
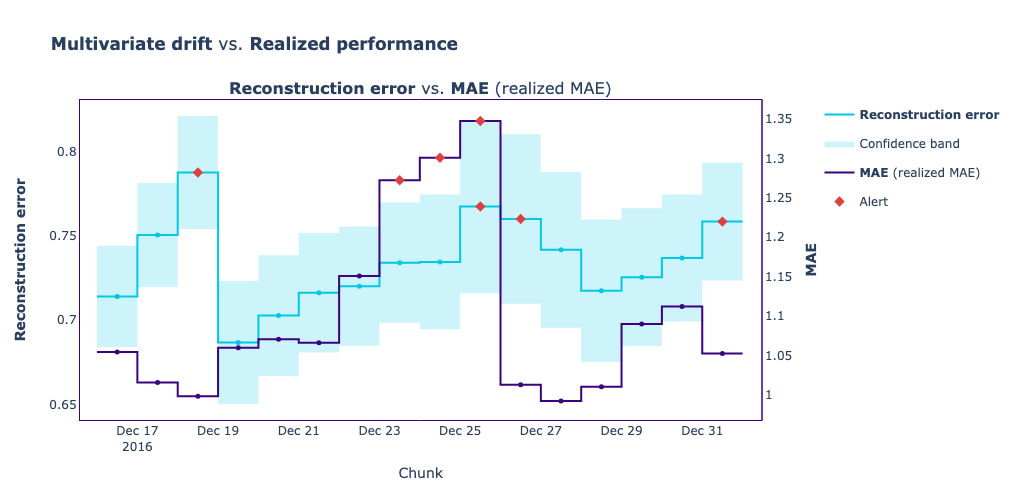
Denk terug aan het Green Taxi-voorbeeld uit hoofdstuk 2, waar het model het fooibedrag voorspelde. In deze oefening hebben we een vergelijkingsgrafiek gemaakt met de dagelijkse waarden van de reconstructiefout uit de multivariate drift-detectiemethode, in lichtblauw, naast de gerealiseerde prestaties berekend met de MAE-metriek, in donkerblauw.
Jouw taak is nu om de dag te identificeren waarop een gealarmeerde drift overlapt met een waarschuwing in de modelprestaties.
Deze oefening maakt deel uit van de cursus
Monitoring Machine Learning in Python
Interactieve oefening met praktijkervaring
Zet theorie om in actie met een van onze interactieve oefeningen
 Begin oefening