Resultaten interpreteren
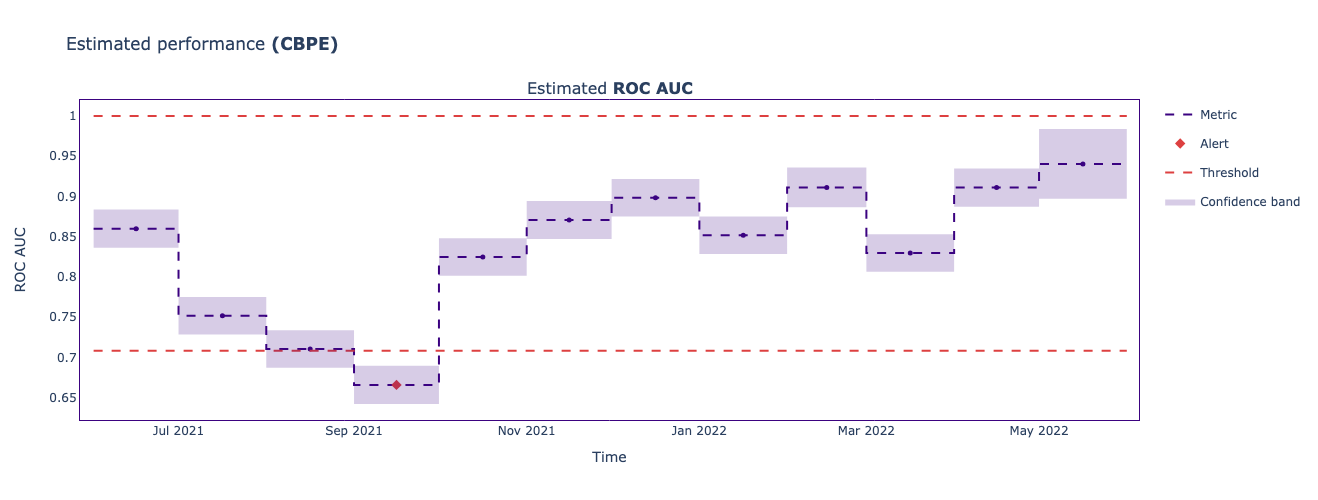
In dit scenario heb je je algoritme voor prestatie-inschatting succesvol in een productieomgeving geïmplementeerd. Daardoor heb je een plot voor de geschatte ROC AUC-metriek.
Je taak is nu om, op basis van de plot, de juiste informatie te selecteren over het volgende:
- chunk-periode - één datapunt in de monitoringsresultaten
- bovendrempel
- onderdrempel
- de naam van de maand waarin een prestatiewaarschuwing wordt geactiveerd
Deze oefening maakt deel uit van de cursus
Monitoring Machine Learning in Python
Interactieve oefening met praktijkervaring
Zet theorie om in actie met een van onze interactieve oefeningen
 Begin oefening