De normale verdeling herkennen
De normale verdeling komt vaak voor in de echte wereld, zoals schoenmaat, lengte van volwassenen, geboortegewicht van baby’s en IQ-scores; daarom is het belangrijk dat je deze verdeling kunt herkennen bij het visualiseren van data.
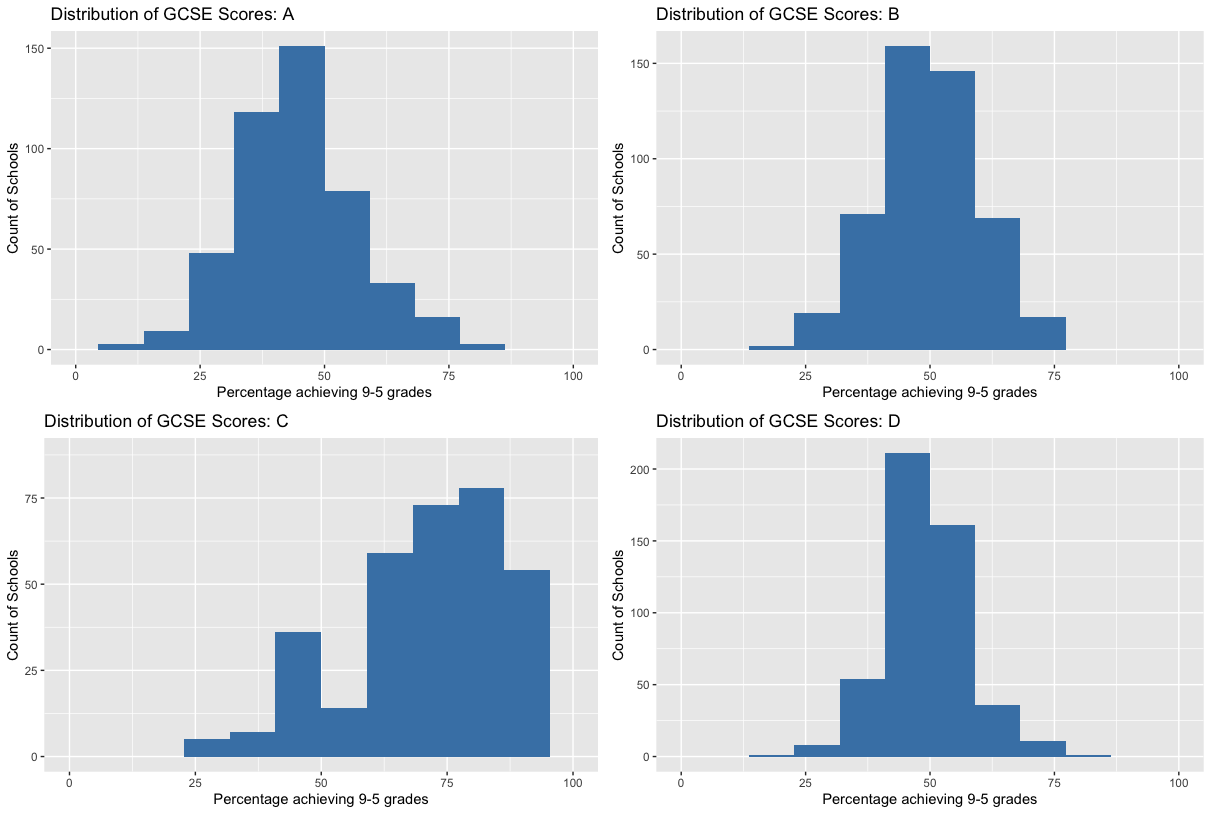
Hier zie je een raster met vier grafieken die de verdeling tonen van scholen die verschillende percentages voldoende cijfers behalen voor middelbare schoolexamens in het Verenigd Koninkrijk. Elke visualisatie vertegenwoordigt leerlingen van een andere etniciteit.
Aan jou de taak om te bepalen welke van deze grafieken géén normale verdeling weergeeft.
Deze oefening maakt deel uit van de cursus
Inleiding tot statistiek
Praktische interactieve oefening
Zet theorie om in actie met een van onze interactieve oefeningen.
 Begin met trainen