Wat kan correlatie je vertellen?
In de vorige oefening zag je een zwakke tot matige negatieve relatie tussen de prijs van een flesje water en het aantal jaarlijks gewerkte uren in verschillende steden. Hier is de plot ter herinnering:
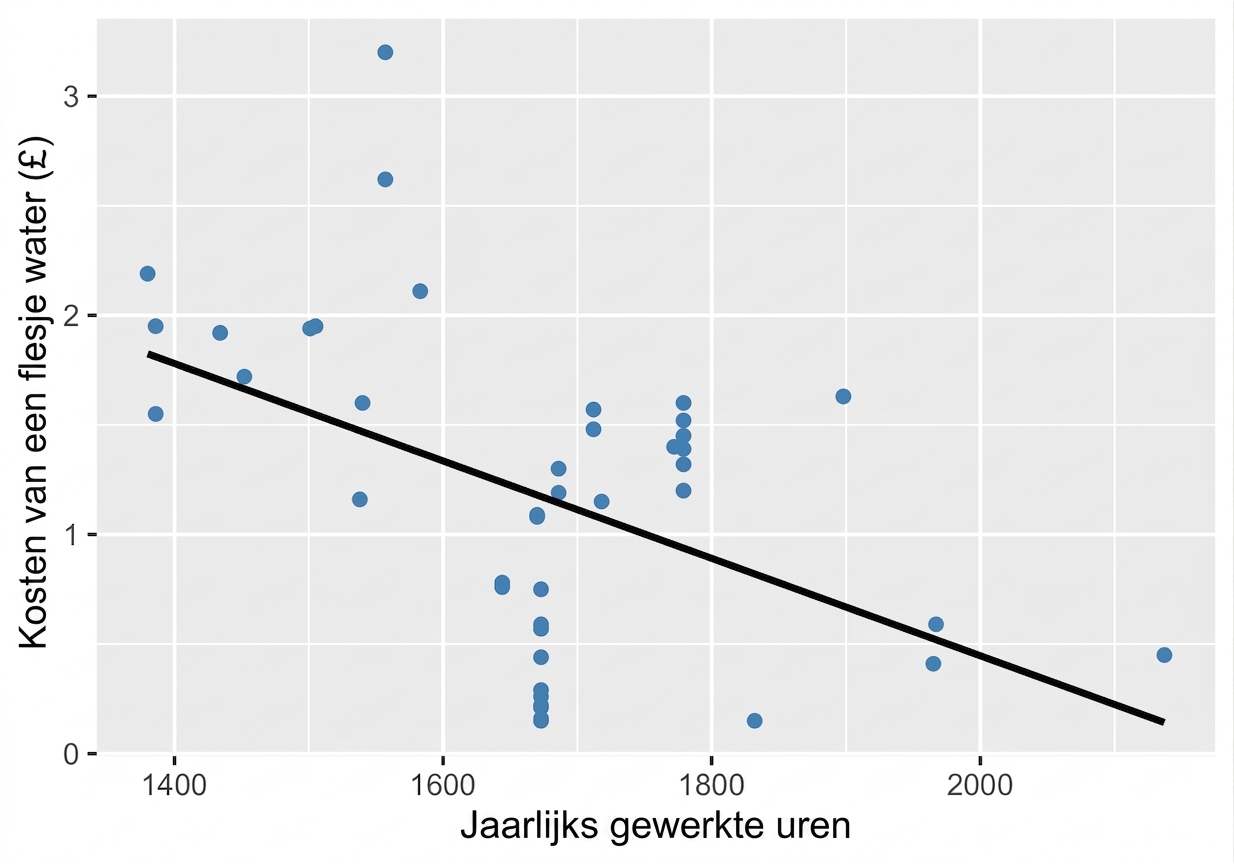
Jouw taak is om de uitspraak te kiezen die nauwkeurig beschrijft wat je redelijkerwijs uit deze visualisatie kunt concluderen.
Deze oefening maakt deel uit van de cursus
Inleiding tot statistiek
Interactieve oefening met praktijkervaring
Zet theorie om in actie met een van onze interactieve oefeningen
 Begin oefening