Sidebar-indelingen
Met layoutfuncties kun je invoer en uitvoer visueel rangschikken in de UI. Een goed gekozen layout maakt een Shiny-app niet alleen mooier, maar verbetert ook de gebruikerservaring.
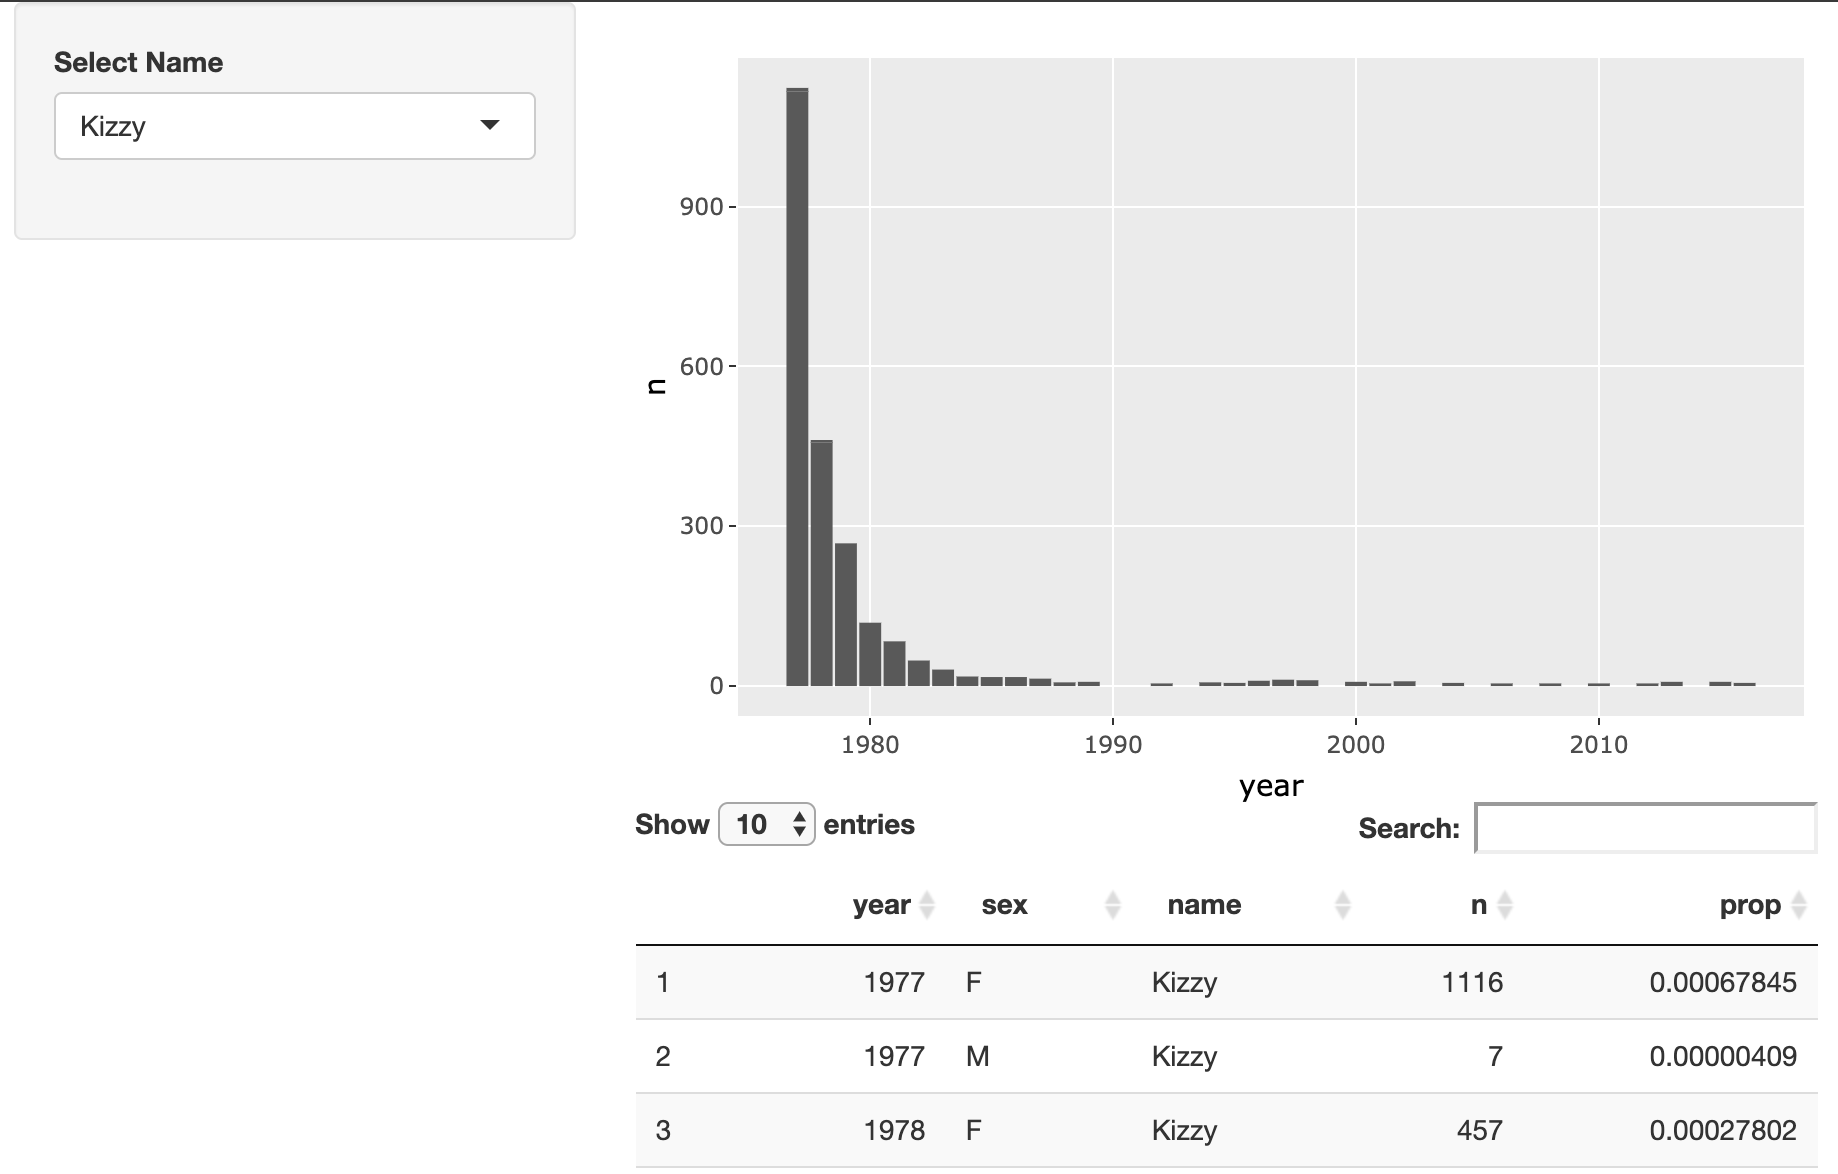
In deze oefening pas je de layout aan van een Shiny-app waarmee gebruikers de populariteit van trendy namen kunnen verkennen. Je uiteindelijke app moet er ongeveer zo uitzien:
Deze oefening maakt deel uit van de cursus
Webapplicaties bouwen met Shiny in R
Oefeninstructies
- Pas de layout van deze app aan zodat de naamselector in de sidebar staat en de grafiek en tabel rechts verschijnen.
Interactieve oefening met praktijkervaring
Probeer deze oefening door deze voorbeeldcode aan te vullen.
ui <- fluidPage(
  # MODIFY CODE BELOW: Wrap in a sidebarLayout
    # MODIFY CODE BELOW: Wrap in a sidebarPanel
    selectInput('name', 'Select Name', top_trendy_names$name),
    # MODIFY CODE BELOW: Wrap in a mainPanel
    plotly::plotlyOutput('plot_trendy_names'),
    DT::DTOutput('table_trendy_names')
)

# DO NOT MODIFY
server <- function(input, output, session){
  # Function to plot trends in a name
  plot_trends <- function(){
     babynames %>%
      filter(name == input$name) %>%
      ggplot(aes(x = year, y = n)) +
      geom_col()
  }
  output$plot_trendy_names <- plotly::renderPlotly({
    plot_trends()
  })

  output$table_trendy_names <- DT::renderDT({
    babynames %>%
      filter(name == input$name)
  })
}

shinyApp(ui = ui, server = server)