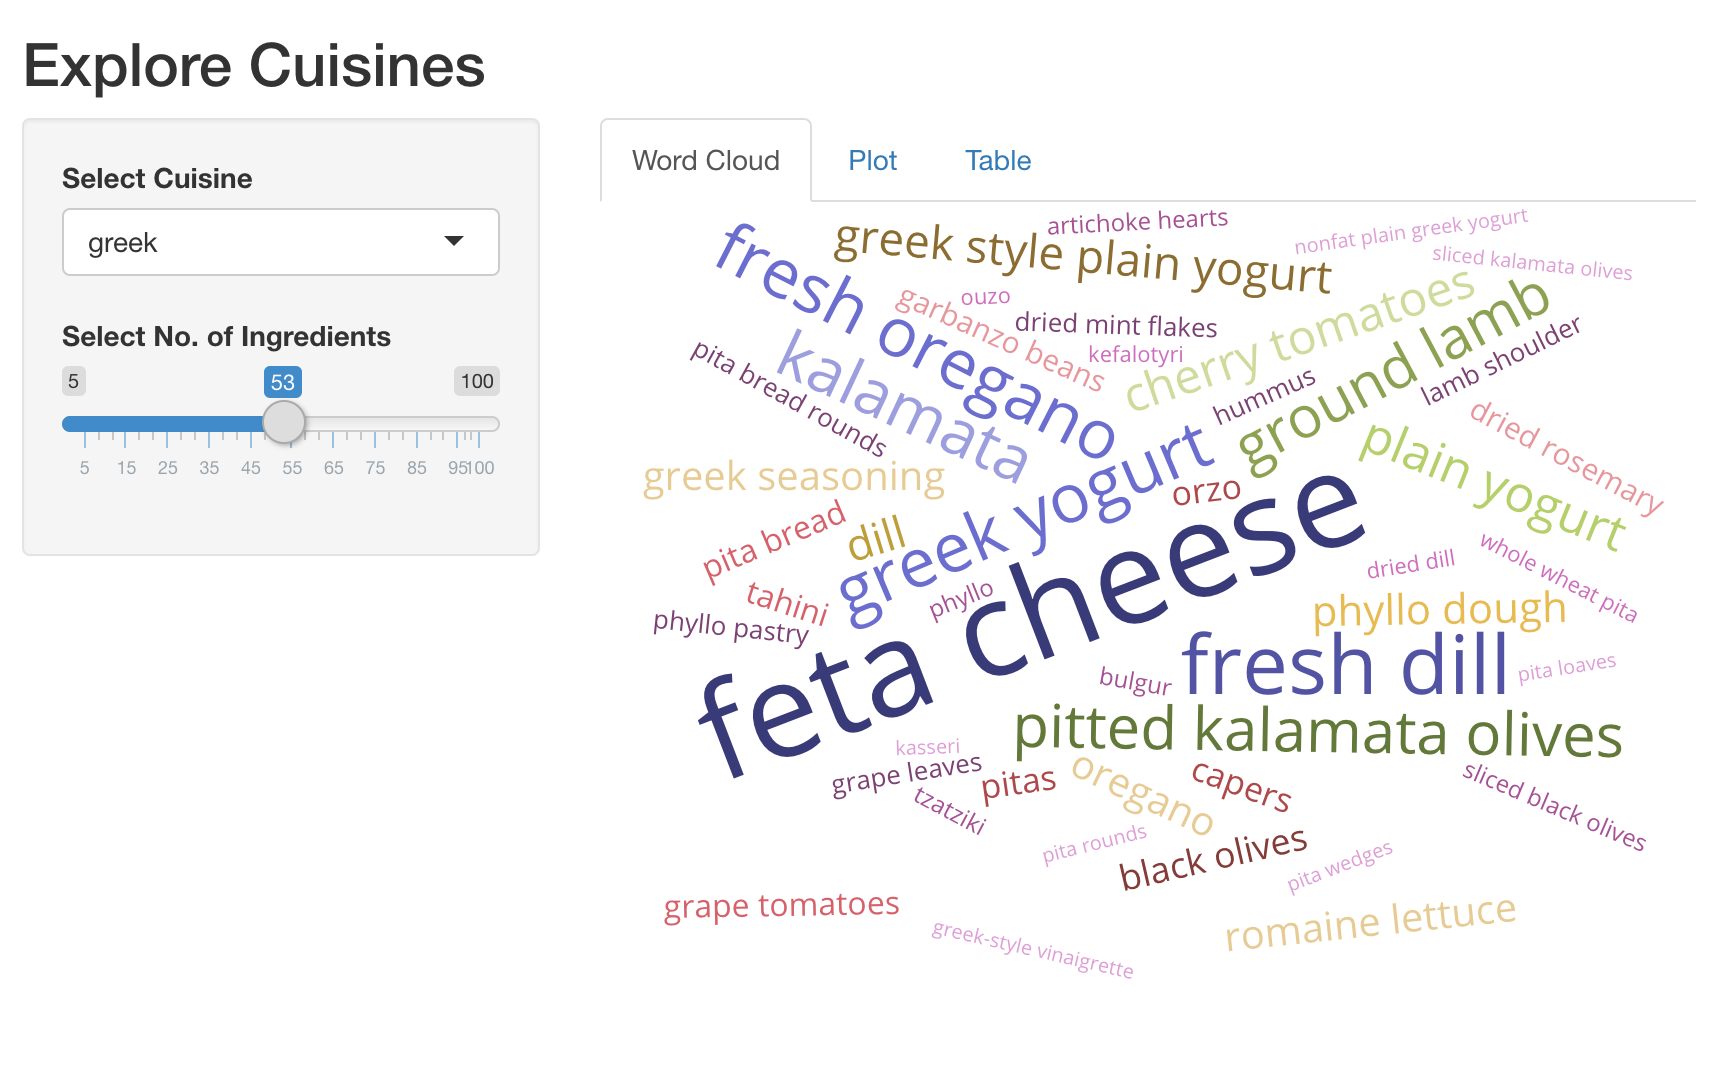
Keukens verkennen: wordclouds
Hopelijk heb je plezier met het bouwen van deze food-Shiny-apps! Een handige manier om veel data te visualiseren is met wordclouds. In deze oefening breid je de Shiny-app uit die we eerder hebben gebouwd en voeg je een nieuw tabblad toe dat de meest onderscheidende ingrediënten als een interactieve wordcloud toont.
We hebben de pakketten shiny, dplyr, ggplot2, plotly en
d3wordcloud al geladen. Hier is een handige snippet om een wordcloud te maken.
d3wordcloud(
  words = c('hello', 'world', 'good'),
  freqs = c(20, 40, 30),
  tooltip = TRUE
)
Deze oefening maakt deel uit van de cursus
Webapplicaties bouwen met Shiny in R
Oefeninstructies
- UI: Voeg een
d3wordcloudOutput()toe met de naamwc_ingredients, en plaats deze in eentabPanel(). Dit moet het eerstetabPanel()in je app zijn. - Server: Render een interactieve wordcloud van top-ingrediënten en
het aantal recepten waarin ze worden gebruikt, met
d3wordcloud::renderD3wordcloud()en koppel deze aan een output met de naamwc_ingredients. Je moet de reactieve expressierval_top_ingredients()gebruiken om een data frame met de top-ingrediënten en hun receptaantallen te krijgen.
Interactieve oefening met praktijkervaring
Probeer deze oefening door deze voorbeeldcode aan te vullen.
ui <- fluidPage(
  titlePanel('Explore Cuisines'),
  sidebarLayout(
    sidebarPanel(
      selectInput('cuisine', 'Select Cuisine', unique(recipes$cuisine)),
      sliderInput('nb_ingredients', 'Select No. of Ingredients', 5, 100, 20),
    ),
    mainPanel(
      tabsetPanel(
        # CODE BELOW: Add `d3wordcloudOutput` named `wc_ingredients` in a `tabPanel`

        tabPanel('Plot', plotly::plotlyOutput('plot_top_ingredients')),
        tabPanel('Table', DT::DTOutput('dt_top_ingredients'))
      )
    )
  )
)

server <- function(input, output, session){
  # CODE BELOW: Render an interactive wordcloud of top ingredients and
  # the number of recipes they get used in, using `d3wordcloud::renderD3wordcloud`,
  # and assign it to an output named `wc_ingredients`.


  rval_top_ingredients <- reactive({
    recipes_enriched %>%
      filter(cuisine == input$cuisine) %>%
      arrange(desc(tf_idf)) %>%
      head(input$nb_ingredients) %>%
      mutate(ingredient = forcats::fct_reorder(ingredient, tf_idf))
  })
  output$plot_top_ingredients <- plotly::renderPlotly({
    rval_top_ingredients() %>%
      ggplot(aes(x = ingredient, y = tf_idf)) +
      geom_col() +
      coord_flip()
  })
  output$dt_top_ingredients <- DT::renderDT({
    recipes %>%
      filter(cuisine == input$cuisine) %>%
      count(ingredient, name = 'nb_recipes') %>%
      arrange(desc(nb_recipes)) %>%
      head(input$nb_ingredients)
  })
}

shinyApp(ui = ui, server= server)