Visualizing retweet network
Visualizing retweets networks is an important exploratory data analysis step because it allows us to visually inspect the structure of the network, understand if there is any user that has disproportionate influence, and if there are different spheres of conversation.
A retweet network visualized with a force directed algorithm may look something like this.
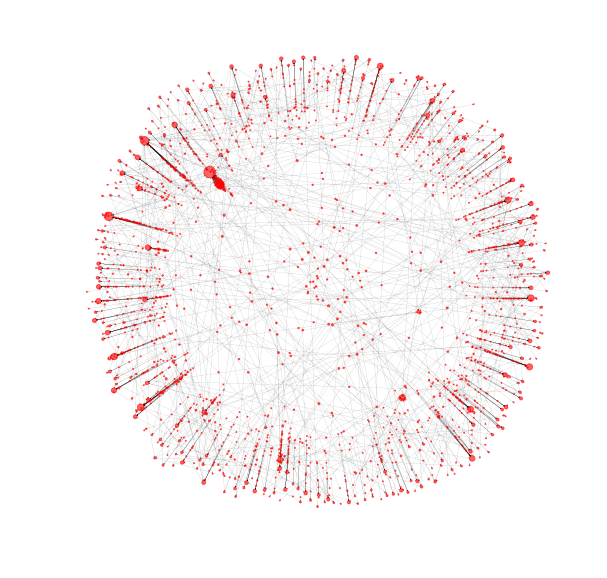
We are going to use a layout which runs quicker to see the plot, but the syntax is nearly the same.
networkx has been imported as nx, and the network has been loaded in G_rt for you.
この演習はコースの一部です
Analyzing Social Media Data in Python
演習の手順
- Generate sizes with a list comprehension. Obtain the second item in
xfor all elements returned by the.degree()method. - Pass the network name as the first argument to
nx.draw_networkx(). - Pass the layout positions as the second argument to
draw_networkx. - Pass the
sizeslist tonode_size.
実践的なインタラクティブ演習
このサンプルコードを完成させて、この演習に挑戦してみましょう。
# Create random layout positions
pos = nx.random_layout(G_rt)

# Create size list
sizes = [x[____] for ____ in G_rt.____()]

# Draw the network
nx.draw_networkx(____, ____,
    with_labels = False,
    node_size = ____,
    width = 0.1, alpha = 0.7,
    arrowsize = 2, linewidths = 0)

# Turn axis off and show
plt.axis('off'); plt.show()