Train/test distributions
In a machine learning interview, you will most certainly work with training data and test data. As discussed earlier, poor model performance can result if the distributions of training and test datasets differ.
In this exercise, you'll use functions from sklearn.model_selection as well as seaborn and matplotlib.pyplot to split loan_data into a training set and a test set, as well as visualize their distributions to spot any discrepancies.
Note that seaborn and matplotlib.pyplot have already been imported to your workspace and aliased as sns and plt, respectively.
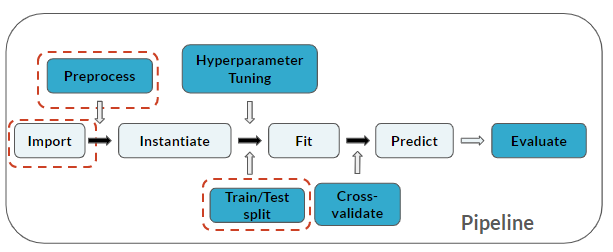
The pipeline now includes Train/Test split:
Questo esercizio fa parte del corso
Practicing Machine Learning Interview Questions in Python
Istruzioni dell'esercizio
- Subset
loan_datato only theCredit ScoreandAnnual Incomefeatures, and the target variableLoan Statusin that order. - Create an 80/20 split of
loan_dataand assign it toloan_data_subset. - Create pairplots of
trainingSetandtestSet(in that order) setting thehueargument to the target variableLoan Status.
esercizio interattivo pratico
Prova questo esercizio completando questo codice di esempio.
# Create `loan_data` subset: loan_data_subset
loan_data_subset = ____[['____','____','____']]

# Create train and test sets
trainingSet, testSet = ____(____, ____=___, random_state=123)

# Examine pairplots
plt.figure()
sns.____(____, hue='____', palette='RdBu')
plt.show()

plt.figure()
sns.____(____, hue='____', palette='RdBu')
plt.show()