Interpreting results
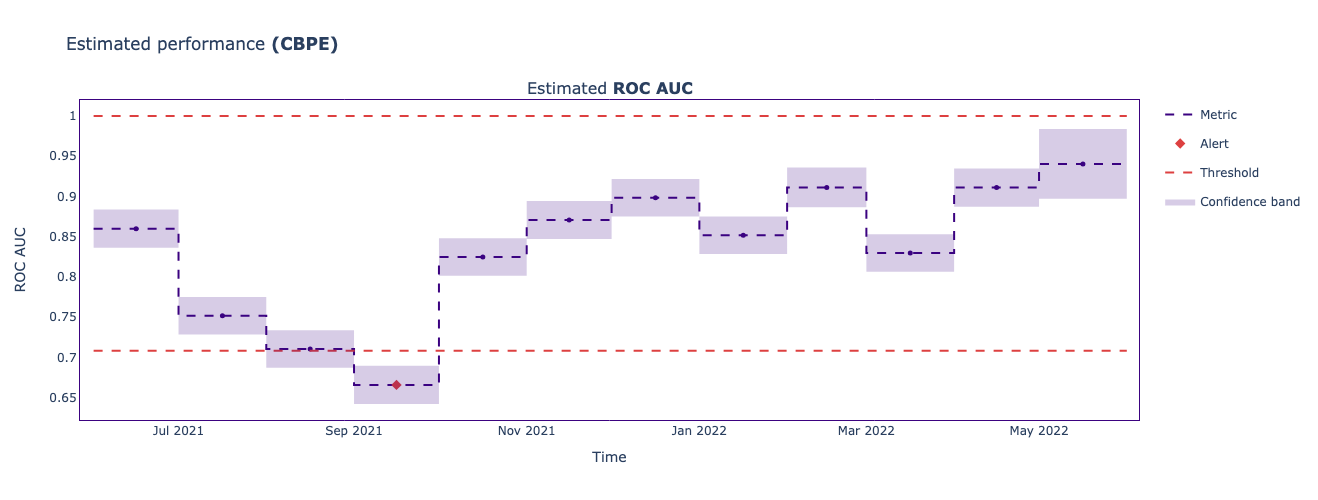
In this scenario, you've successfully implemented your performance estimation algorithm in a production environment. As a result, you have a plot for estimated ROC AUC metric.
Your task now is to select correct information based on the plot about the following:
- chunk period - a single data point on the monitoring results
- upper threshold
- lower threshold
- the name of the month when a performance alert is triggered
Questo esercizio fa parte del corso
Monitoring Machine Learning in Python
esercizio interattivo pratico
Trasforma la teoria in pratica con uno dei nostri esercizi interattivi
 Inizia esercizio