Menafsirkan dendrogram
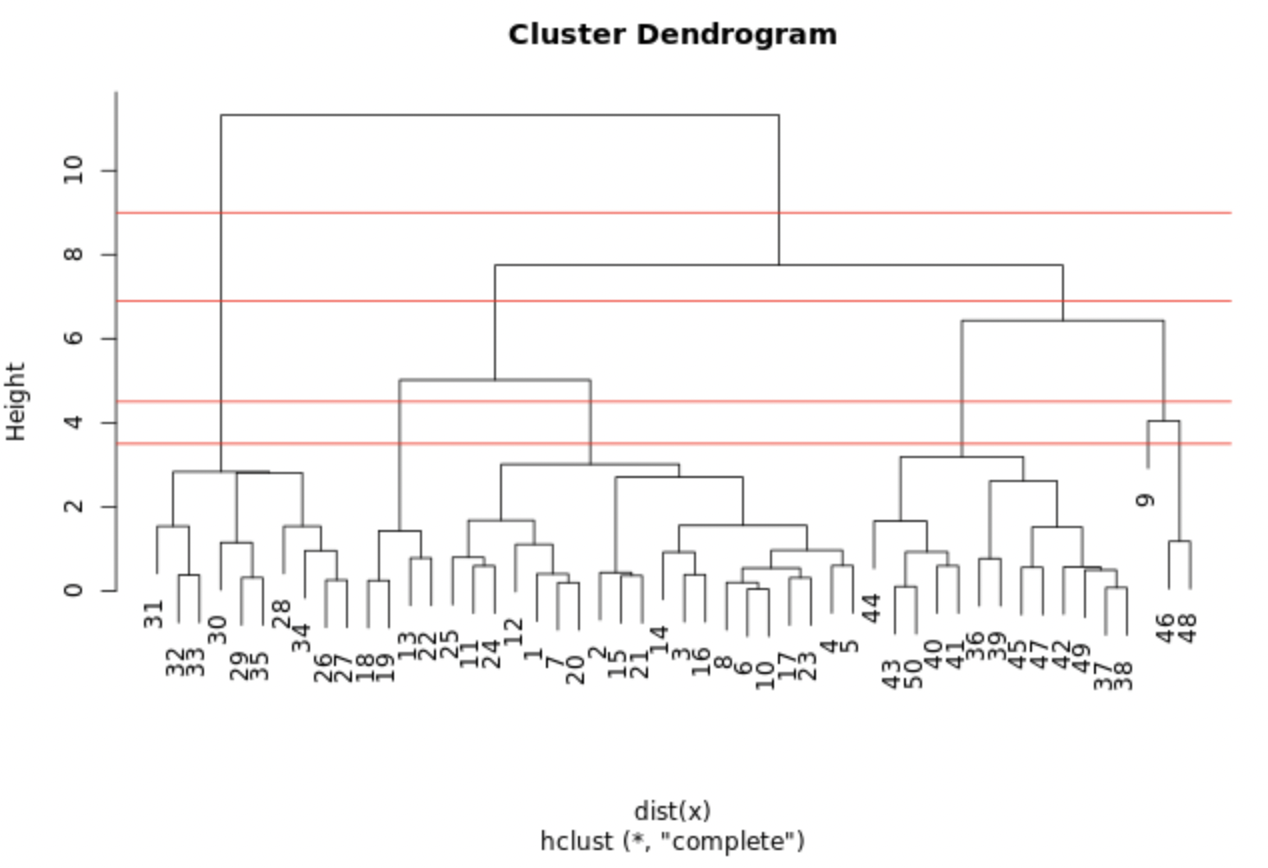
Plot yang ditampilkan menunjukkan model hclust.out yang Anda bangun pada latihan sebelumnya. Kami menggambar garis horizontal masing-masing pada ketinggian 3,5; 4,5; 6,9; dan 9,0.
Titik potong mana yang menghasilkan 3 klaster?
Latihan ini merupakan bagian dari kursus
Unsupervised Learning di R
Latihan interaktif langsung
Ubah teori menjadi aksi dengan salah satu latihan interaktif kami
 Mulai latihan