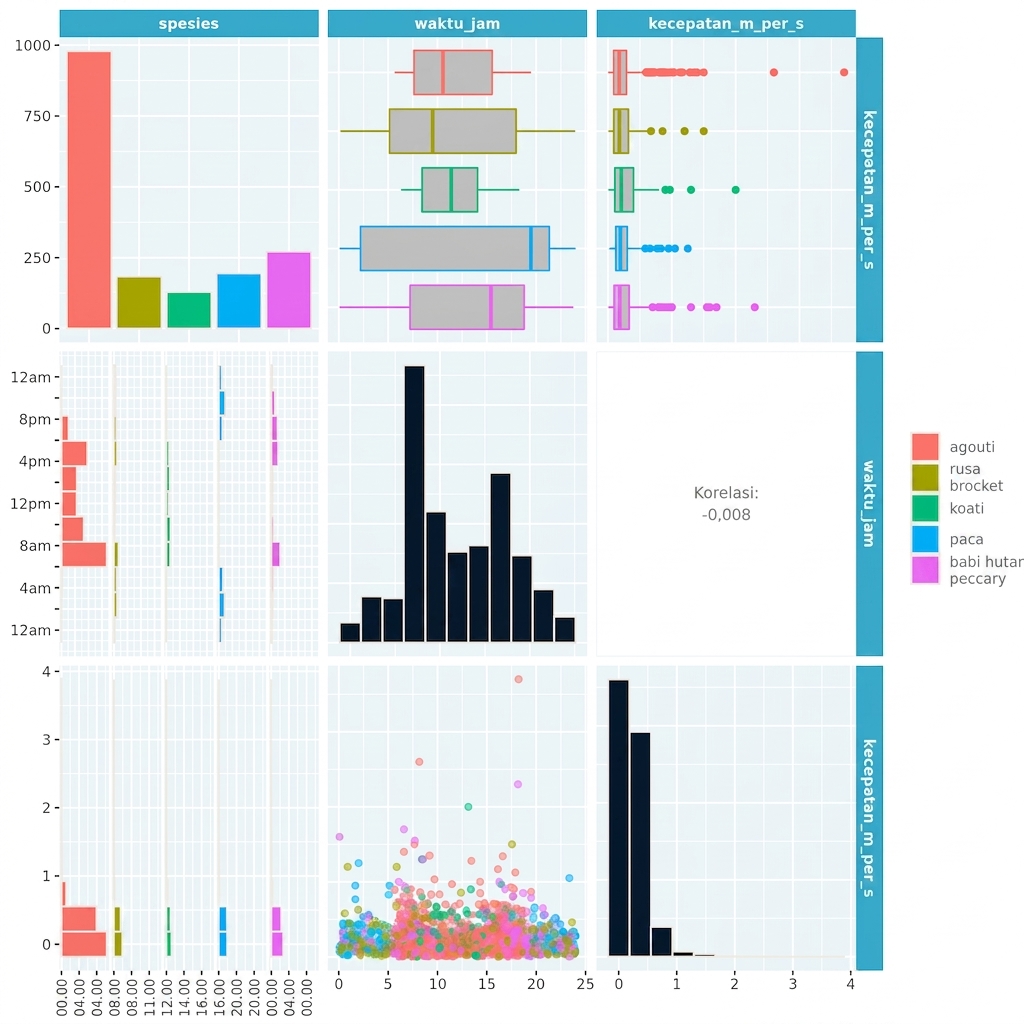
Menafsirkan pair plot
Untuk mendapatkan gambaran cepat tentang suatu himpunan data, sangat membantu untuk membuat plot distribusi setiap variabel dan hubungan antara setiap pasangan variabel. Sebuah pair plot menampilkan semua plot tersebut bersama-sama dalam matriks panel. Ini menunjukkan banyak informasi sekaligus, jadi untuk menafsirkannya, cobalah melihat satu panel pada satu waktu.
Di sini Anda dapat melihat data kamera jebak Panama untuk agouti dan paca, serta tiga spesies baru: coati, brocket, dan peccary.
Latihan ini merupakan bagian dari kursus
Memahami Visualisasi Data
Latihan interaktif langsung
Ubah teori menjadi aksi dengan salah satu latihan interaktif kami
 Mulai latihan