Facet grid प्लॉट बनाना
पिछले अभ्यास में, आपने यह कोड लिखा था:
# Subset tech and fmcg companies
subset_dat = dataset.loc[dataset["comp_type"].isin(["tech", "fmcg"])]

# Compute yearly average gross margin ratio of tech and fmcg companies
subset_dat_avg = subset_dat.pivot_table(index=["Year", "comp_type"], values = "gross_margin").reset_index()

#Add column company
subset_dat_avg["company"] = np.where(subset_dat_avg["comp_type"]=="tech", "Avg tech", "Avg fmcg")

#Concat the DataFrames
plot_df = pd.concat([subset_dat, subset_dat_avg], axis=0)
इस कोड ने डेटा को निम्न प्लॉट बनाने के लिए तैयार किया था:
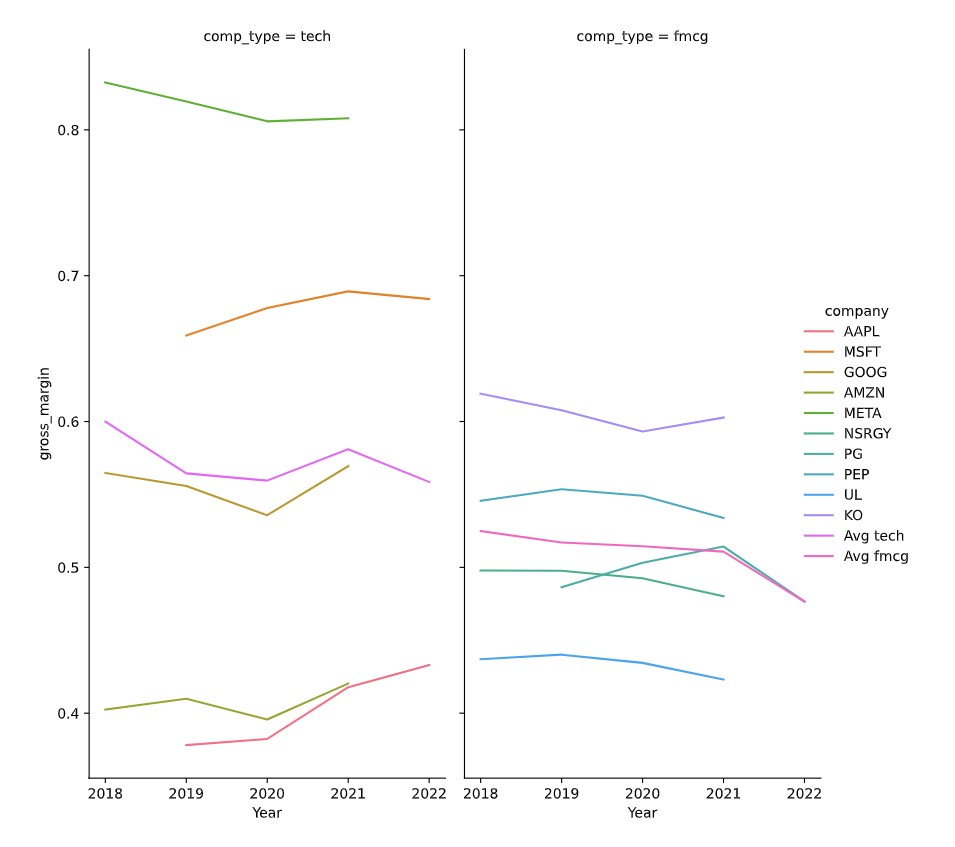
अब प्लॉट बनाने की बारी है.
यह अभ्यास पाठ्यक्रम का हिस्सा है
Python में Financial Statements का विश्लेषण
अभ्यास निर्देश
seabornका उपयोग करके विवरण में बताए गए facet grid प्लॉट के लिए DataFrameplot_dfका उपयोग करें.
इंटरैक्टिव व्यावहारिक अभ्यास
इस अभ्यास को इस नमूना कोड को पूरा करके आज़माएँ।
# Make the plot
sns.relplot(data=plot_df.reset_index(drop=True), ____)
plt.show()
plt.close()