Bombes nucléaires par pays
Vous disposez d’une version de la Nuclear Explosion DataBase (NEDB) où les noms des pays figurent dans les en-têtes de colonnes (nuke_df). Vous souhaitez visualiser combien de bombes ont été déclenchées chaque année et par pays. Vous devrez d’abord réorganiser les données et remplacer les valeurs NA.
Le package ggplot2 a été préchargé pour vous.
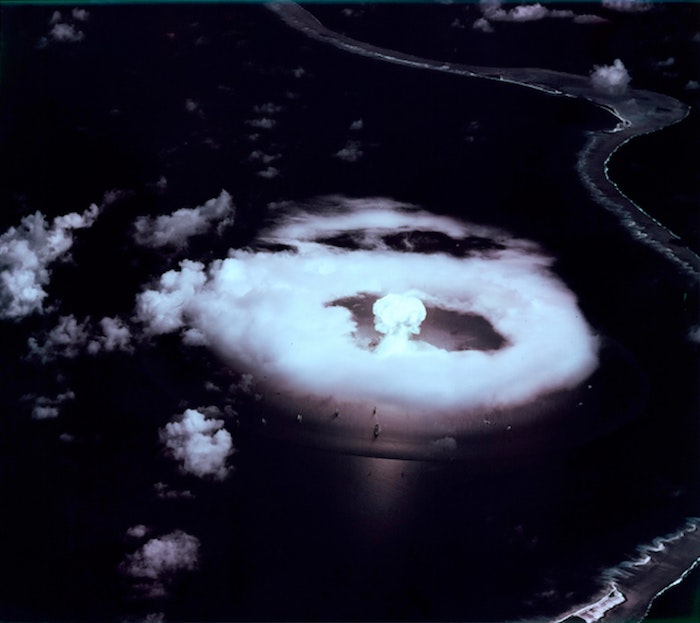
« A-Day » Première explosion de bombe atomique à Bikini, dans les îles Marshall, le 1er juillet 1946.
Cet exercice fait partie du cours
<cours>Reshaper des données avec tidyr</cours>Exercice interactif pratique
Essayez cet exercice en complétant ce code d’exemple.
nuke_df %>%
  # Pivot the data to a longer format
  ___