Déjà ?
Imaginez le scénario suivant : vous avez entraîné un modèle avec une année complète de données étiquetées et l’avez déployé en production.
Un jour après le déploiement, vous consultez votre tableau de bord de monitoring des données et vous voyez l’image suivante, où les entrées d’entraînement sont en bleu et les entrées de production en orange.
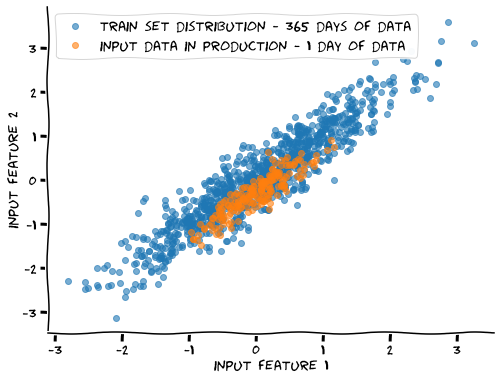
Quelle conclusion pouvez-vous tirer avec certitude ?
Cet exercice fait partie du cours
<cours>Déploiement MLOps et cycle de vie</cours>Exercice interactif pratique
Transformez la théorie en action avec l’un de nos exercices interactifs
 Commencer l’exercice