Régressions bootstrapées
En travaillant pour le service des parcs et loisirs de Long Beach afin d’étudier la relation entre NO2 et SO2, vous avez remarqué un groupe de valeurs potentiellement aberrantes qui, selon vous, faussent les corrélations.
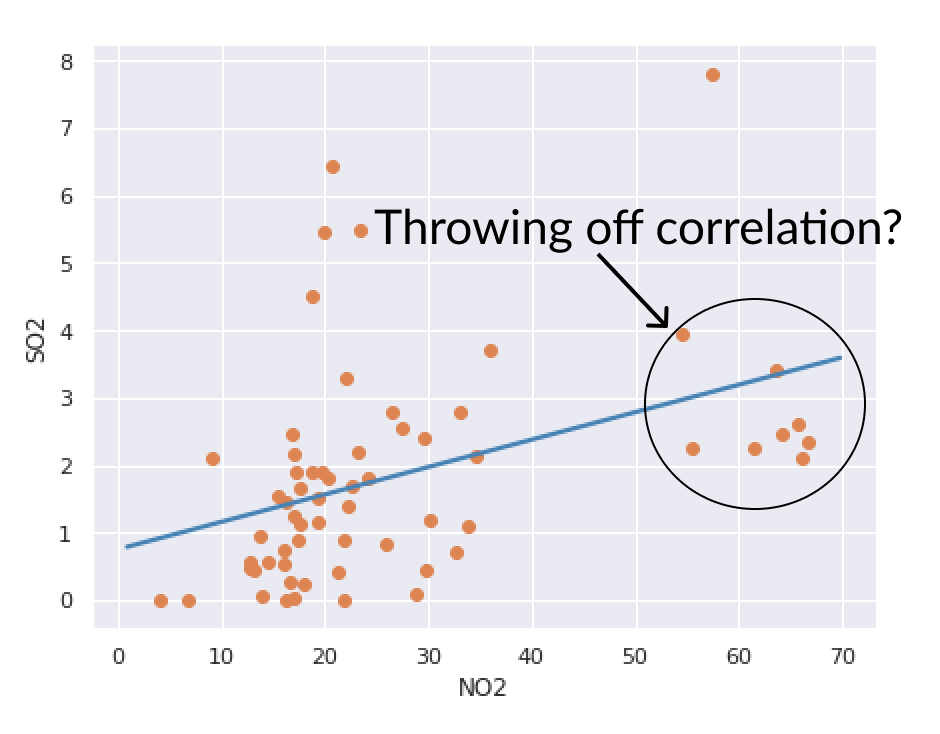
Examinez l’incertitude de vos corrélations via un rééchantillonnage bootstrap pour évaluer la stabilité de vos ajustements. Pour votre confort, l’échantillonnage bootstrap est déjà effectué et fourni sous le nom no2_so2_boot, ainsi que no2_so2 pour les données non rééchantillonnées.
Cet exercice fait partie du cours
<cours>Améliorer vos visualisations de données en Python</cours>Instructions de l’exercice
- Indiquez à
sns.lmplot()qu’il doit tracer une droite de régression distincte pour chaquesampledu bootstrap. - Colorez chaque droite de régression en
'steelblue'et rendez-les opaques à 20 %. - Désactivez les bandes de confiance par défaut de Seaborn autour des droites de régression.
Exercice interactif pratique
Essayez cet exercice en complétant ce code d’exemple.
sns.lmplot('NO2', 'SO2', data = no2_so2_boot,
           # Tell seaborn to a regression line for each sample
           ____ = 'sample',
           # Make lines blue and transparent
           line_kws = {'____': 'steelblue', '____': 0.2},
           # Disable built-in confidence intervals
           ci = ____, legend = False, scatter = False)

# Draw scatter of all points
plt.scatter('NO2', 'SO2', data = no2_so2)

plt.show()