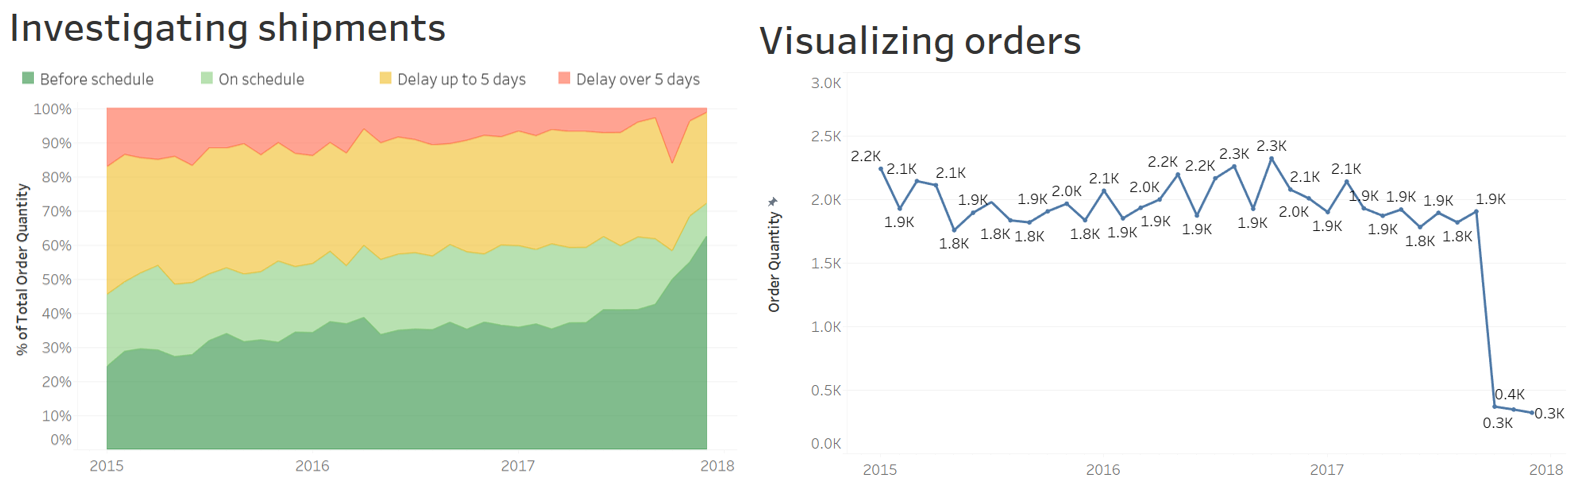
Tirer des conclusions à partir des graphiques
Quelle(s) phrase(s) résume(nt) correctement ces deux visualisations ?
Cet exercice fait partie du cours
<cours>Étude de cas : l’analyse de la chaîne d’approvisionnement avec Tableau</cours>Exercice interactif pratique
Transformez la théorie en action avec l’un de nos exercices interactifs
 Commencer l’exercice