IC y nivel de confianza
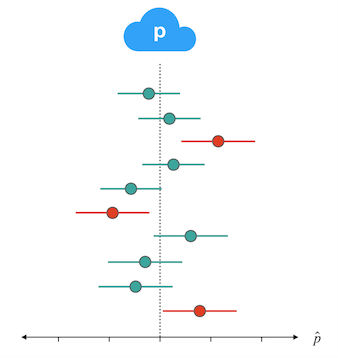
Aprendimos que para un intervalo de confianza del 95% (un nivel de confianza de 0.95), si tomáramos muchas muestras del mismo tamaño y calculáramos muchos intervalos, esperaríamos que el 95% de esos intervalos contuvieran el parámetro. Basándote en el conjunto de intervalos de confianza representados aquí, ¿cuál es tu mejor estimación del nivel de confianza usado en estos intervalos?
Como en el vídeo, la proporción poblacional está representada por la p en la nube y la línea discontinua, y cada intervalo de confianza está representado por un segmento que parte de su p con sombrero (p-hat). Los intervalos que contienen el valor verdadero están en verde; los que no lo capturan están en rojo.
Este ejercicio forma parte del curso
Inferencia para datos categóricos en R
ejercicio interactivo práctico
Convierte la teoría en práctica con uno de nuestros ejercicios interactivos
 Empezar ejercicio