Entender las tablas de contingencia
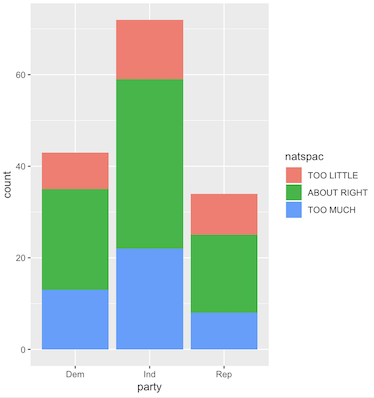
El gráfico de barras de recuentos que construiste es una representación visual de una tabla de contingencia.
¿Cuál de las siguientes afirmaciones es FALSA respecto a las tablas de contingencia?
Este ejercicio forma parte del curso
Inferencia para datos categóricos en R
ejercicio interactivo práctico
Convierte la teoría en práctica con uno de nuestros ejercicios interactivos
 Empezar ejercicio