Creating a confusion matrix
In this example, assume that you have run a model and stored the predicted outcomes in a vector called model_pred. You want to see how the model performed so you will construct a confusion matrix. You will compare the actual loan status column (loan_status) to the predicted values (model_pred), using the table() function, where the arguments are the true values and the predicted values. Recall the confusion matrix structure:
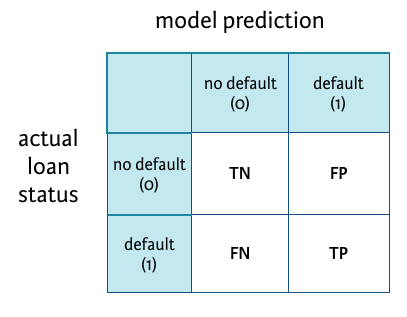
and formulas:
$$\textrm{Classification accuracy} = \frac{(TP + TN)}{(TP + FP + TN + FN)}$$
$$\textrm{Sensitivity} = \frac{TP}{(TP + FN)}$$
$$\textrm{Specificity} = \frac{TN}{(TN + FP)}$$
Diese Übung ist Teil des Kurses
<Kurs>Credit Risk Modeling in R</Kurs>Übungsanweisungen
- Create a confusion matrix comparing the
loan_statuscolumn intest_setwith the vectormodel_pred. You can use the table() function with two arguments to do this. Store the matrix in objectconf_matrix. - Compute the classification accuracy and print the result. You can either select the correct matrix elements from the confusion matrix using
conf_matrix, or copy and paste the desired values. - Compute the sensitivity and print the result.
Interaktive praktische Übung
Versuche dich an dieser Übung, indem du diesen Beispielcode vervollständigst.
# Create confusion matrix


# Compute classification accuracy


# Compute sensitivity