Seitenleisten-Layouts
Mit Layoutfunktionen kannst du Eingaben und Ausgaben in der UI visuell anordnen. Ein gut gewähltes Layout macht eine Shiny-App nicht nur ansprechender, sondern verbessert auch die User Experience.
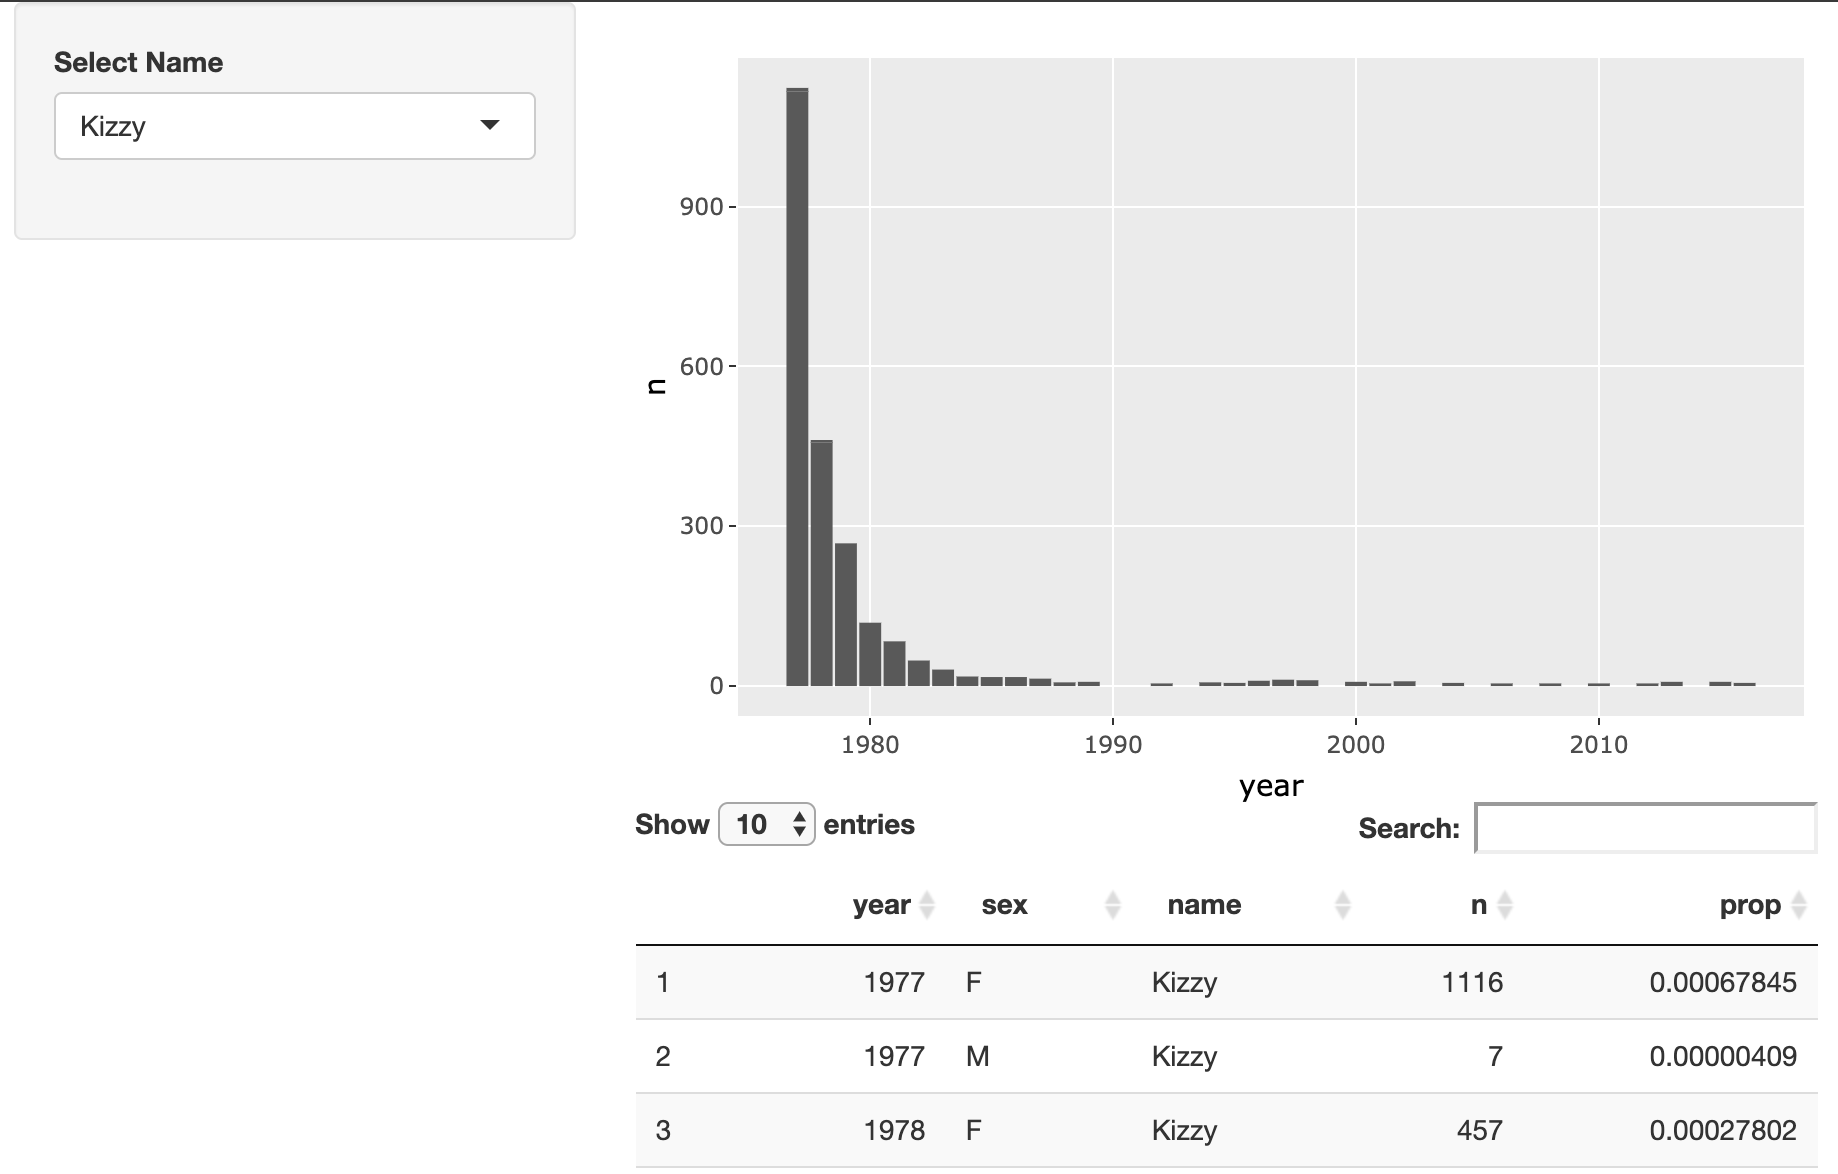
In dieser Übung passt du das Layout einer Shiny-App an, mit der Nutzerinnen und Nutzer die Popularität trendiger Namen erkunden können. Deine finale App sollte optisch so aussehen:
Diese Übung ist Teil des Kurses
<Kurs>Webanwendungen mit Shiny in R entwickeln</Kurs>Übungsanweisungen
- Ändere das Layout dieser App so, dass der Namensauswähler in der Seitenleiste erscheint und Plot sowie Tabelle rechts im Hauptbereich zu sehen sind.
Interaktive praktische Übung
Versuche dich an dieser Übung, indem du diesen Beispielcode vervollständigst.
ui <- fluidPage(
  # MODIFY CODE BELOW: Wrap in a sidebarLayout
    # MODIFY CODE BELOW: Wrap in a sidebarPanel
    selectInput('name', 'Select Name', top_trendy_names$name),
    # MODIFY CODE BELOW: Wrap in a mainPanel
    plotly::plotlyOutput('plot_trendy_names'),
    DT::DTOutput('table_trendy_names')
)

# DO NOT MODIFY
server <- function(input, output, session){
  # Function to plot trends in a name
  plot_trends <- function(){
     babynames %>%
      filter(name == input$name) %>%
      ggplot(aes(x = year, y = n)) +
      geom_col()
  }
  output$plot_trendy_names <- plotly::renderPlotly({
    plot_trends()
  })

  output$table_trendy_names <- DT::renderDT({
    babynames %>%
      filter(name == input$name)
  })
}

shinyApp(ui = ui, server = server)