Erkunde die Mental Health in Tech Survey 2014
Lass dich nicht einschüchtern: In dieser Übung baust du die komplette App (abgesehen von der benutzerdefinierten Fehlermeldung) in einem Rutsch!
Für diese App verwendest du die Fragen „Denkst du, dass das Ansprechen eines psychischen Problems mit deinem Arbeitgeber negative Konsequenzen hätte?“ (die Variable mental_health_consequence) und „Hast du das Gefühl, dass dein Arbeitgeber psychische Gesundheit genauso ernst nimmt wie körperliche Gesundheit?“ (mental_vs_physical) als Multi-Select-Eingaben und zeigst anschließend ein Histogramm des Age der Befragten an. Um die Auswahlmöglichkeiten für diese Variablen zu sehen, verwende count() in der Konsole.
Zur Erinnerung: Wenn du fertig bist, sieht die App so aus (einschließlich des leeren Plots):
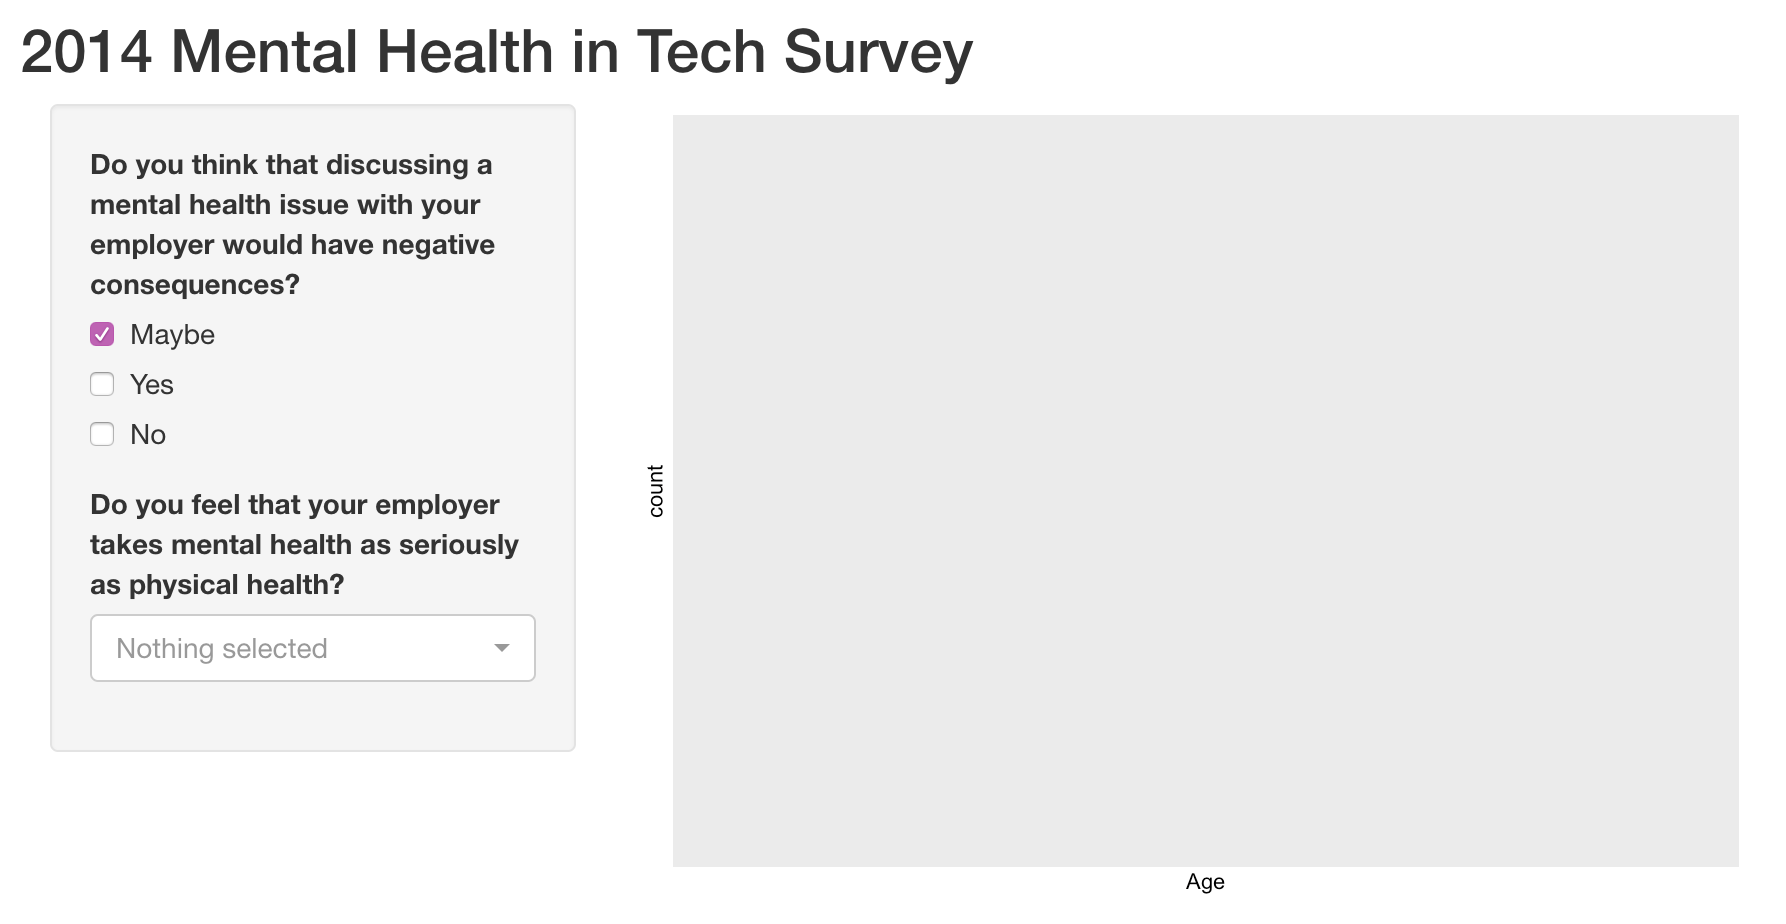
shiny, ggplot2, dplyr und der Datensatz mental_health_survey wurden bereits für dich geladen.
Diese Übung ist Teil des Kurses
<Kurs>Webanwendungen mit Shiny in R entwickeln</Kurs>Übungsanweisungen
- UI:
- Füge der App einen passenden Titel hinzu.
- Füge ein
checkboxGroupInput()hinzu. Gib einen Standardwert für das Argumentselectedan. - Füge ein
pickerInput()hinzu und setze das ArgumentmultipleaufTRUE. - Füge im Main Panel ein
plotOutput()hinzu.
- Server:
- Füge eine Ausgabe hinzu, die ein Histogramm des
Ageder Befragten anzeigt, gefiltert nach den beiden Eingaben.
- Füge eine Ausgabe hinzu, die ein Histogramm des
Interaktive praktische Übung
Versuche dich an dieser Übung, indem du diesen Beispielcode vervollständigst.
ui <- fluidPage(
  # CODE BELOW: Add an appropriate title

  sidebarPanel(
  	# CODE BELOW: Add a checkboxGroupInput


  	# CODE BELOW: Add a pickerInput


  ),
  mainPanel(
	# CODE BELOW: Display the output

  )
)

server <- function(input, output, session) {
  # CODE BELOW: Build a histogram of the age of respondents
  # Filtered by the two inputs


}

shinyApp(ui, server)