Farben einstellen
Neben den farbcodierten status-Einstellungen gibt es weitere Farben, die für Objekte wie valueBox() und infoBox() gesetzt werden können.
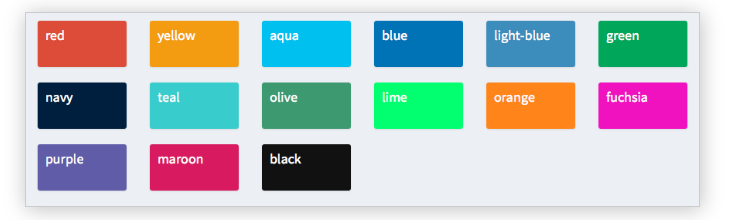
Im Folgenden setzt du verschiedene Farben im Body eines shinydashboard, auch wenn diese Objekte – wie wir in einem früheren Beispiel gesehen haben – ebenfalls im server() definiert werden können.
In dieser Übung wurden die Bibliotheken shiny und shinydashboard bereits für dich geladen. Außerdem wurden Header und Sidebar als header und sidebar gespeichert, und server() ist eine leere Funktion.
Diese Übung ist Teil des Kurses
<Kurs>Dashboards mit shinydashboard erstellen</Kurs>Interaktive praktische Übung
Versuche dich an dieser Übung, indem du diesen Beispielcode vervollständigst.
library(shiny)
library(shinydashboard)

header <- dashboardHeader(
  title = "Portfolio dashboard for Sally",
  titleWidth = 300,
  dropdownMenu(type = "notifications",
       notificationItem("Sell alert", status = "danger"),
       notificationItem("Buy alert", status = "success"))
)

sidebar <- dashboardSidebar(
  width = 300,
  sidebarMenu(
    id = "pages",
    menuItem("Historical trends",
             tabName = "historical"),
    menuItem("Profits and Losses (PnLs)",
             tabName = "profit",
             icon = icon("money-bill-alt"),
             badgeLabel = "+2.3%", badgeColor = "green")
  )
)

body <- dashboardBody(tabItems(
  tabItem(tabName = "historical",
          fluidRow(box(selectInput("stock", "Select stock symbol",
                                   choices=c("AAPL", "DIS"))),
                   box("Stock name",
                       title="Stock name title",
                       width = 6,
                       status = "info", solidHeader = TRUE)),
          # Set the color of each infoBox to black
          fluidRow(infoBox("Open", "value", width = 2, color = ___),
                   infoBox("High", "value", width = 2,___),
                   infoBox("Low", "value", width = 2, ___),
                   infoBox("Close", "value", width = 2, ___),
                   # Set the color of the last infoBox to navy and set its width to 4
                   infoBox("Volume", "value", ___)),
          fluidRow(valueBox("Open (%)", "0%", width = 2),
                   valueBox("High (%)", "+1%", width = 2),
                   valueBox("Low (%)", "-4%", width = 2),
                   valueBox("Close (%)", "-2%", width = 2),
                   valueBox("Volume (%)", "+30%", width = 2)),
          fluidRow(box("Candlestick chart", width = 12, height = 350)),
          fluidRow(box("Volume chart", width = 12, height = 200))),
  tabItem(tabName = "profit",
          fluidRow(box("valueBox", "Account balance", width = 3),
                   box("valueBox",  "Value at Risk (Var)", width = 3),
                   box("valueBox", "Returns", width = 3),
                   box("valueBox", "Profit-to-loss ratio", width = 3)),
          fluidRow(box("PnL chart", width = 12, height = 400)))
)
)

ui <- dashboardPage(header, sidebar, body)
server <- function(input, output){}
shinyApp(ui, server)