Understanding KPI chart trends
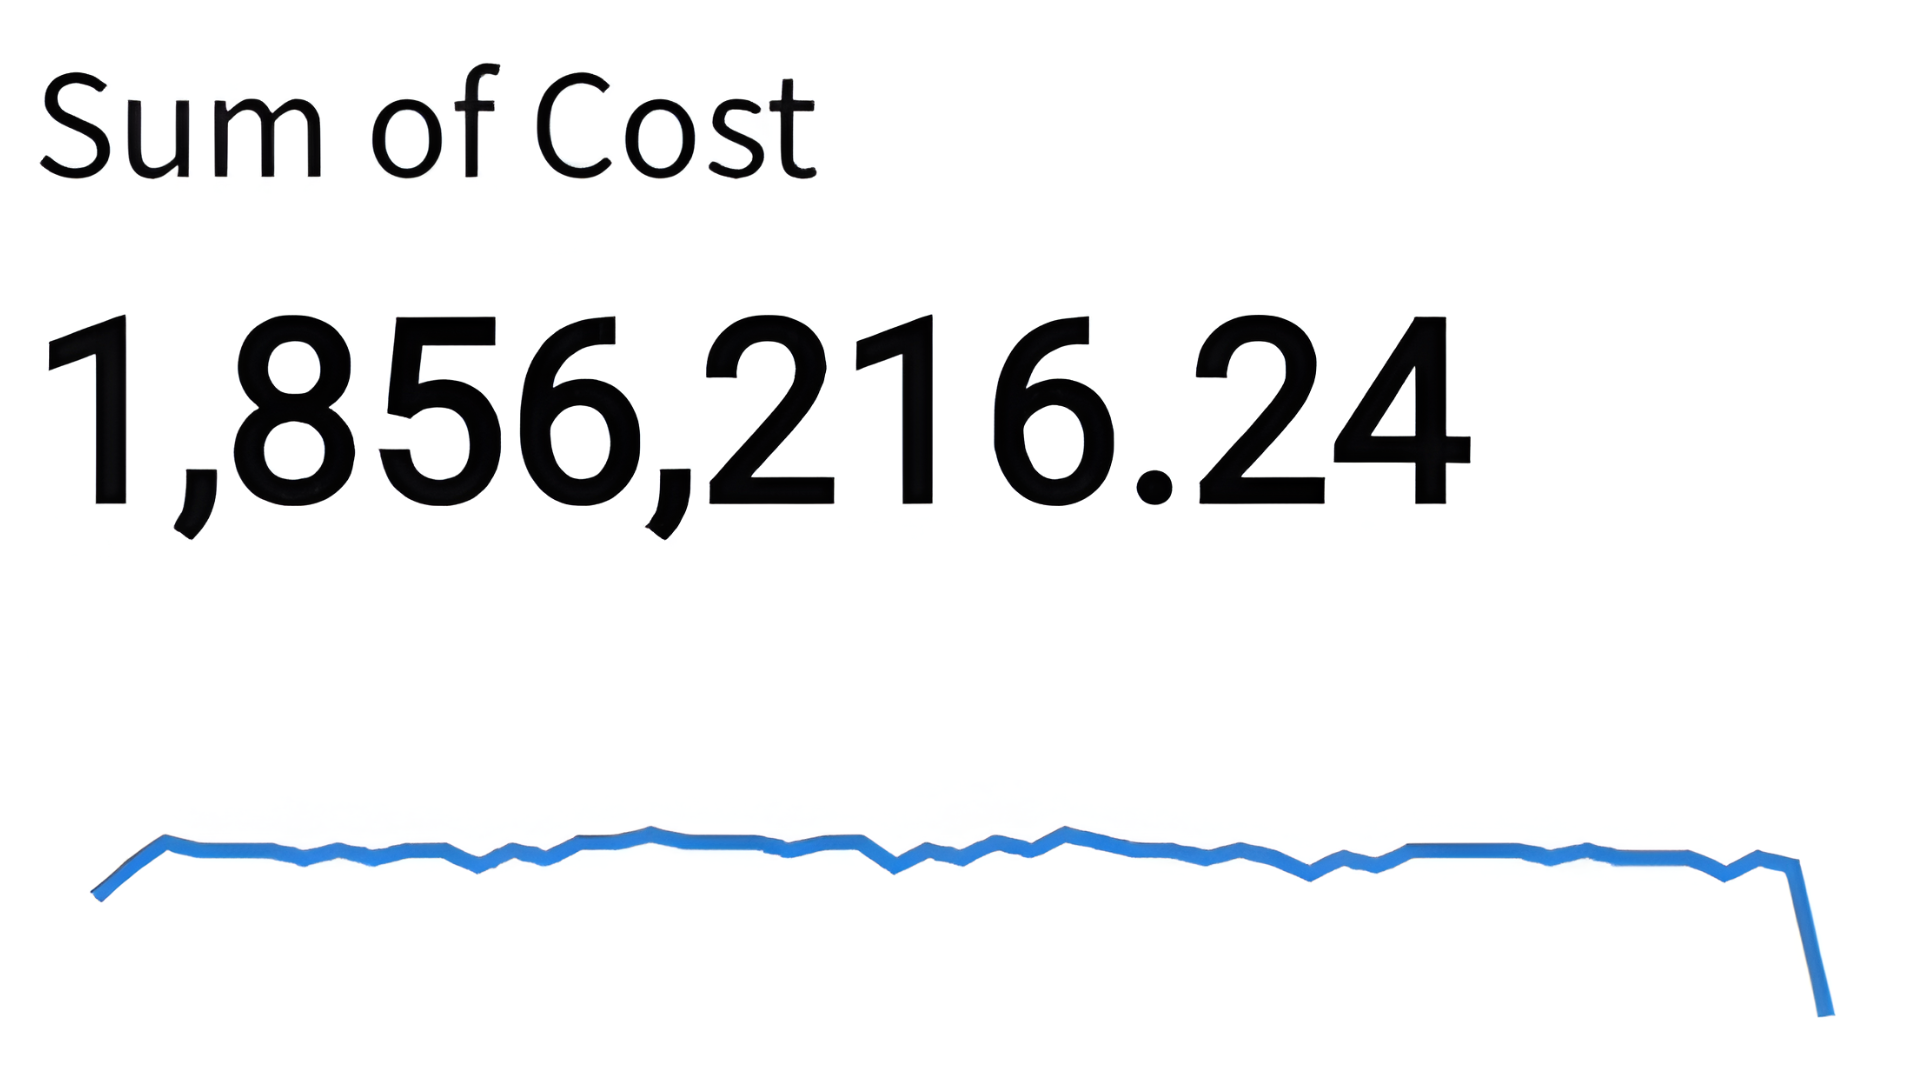
The line under this KPI chart is called the (A). It requires a field to be dropped on the chart’s timeline menu, and (B) for all KPI charts.
This exercise is part of the course
Visualizations in Sigma
Hands-on interactive exercise
Turn theory into action with one of our interactive exercises
 Start Exercise