Q-Q plot of residuals
Here are normal Q-Q plots of the previous two models.
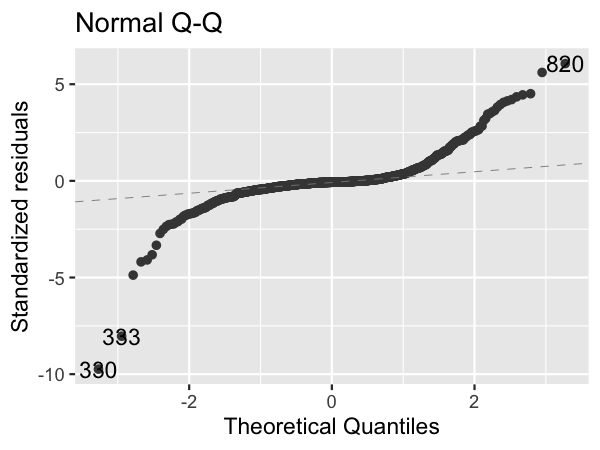
Original model (n_clicks versus n_impressions)
Transformed model (n_clicks ^ 0.25 versus n_impressions ^ 0.25)
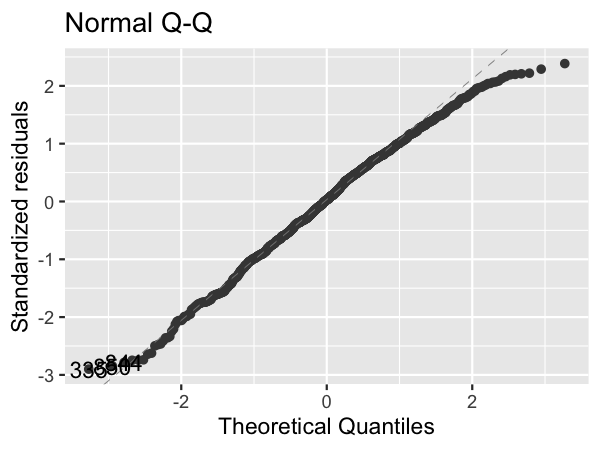
Look at how well the points track the "normality" line. Which statement is true?
This exercise is part of the course
Introduction to Regression in R
Hands-on interactive exercise
Turn theory into action with one of our interactive exercises
 Start Exercise