Residuals vs. fitted values
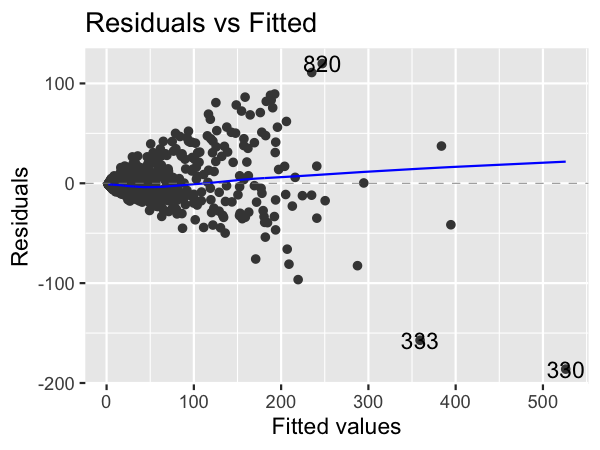
Here you can see diagnostic plots of residuals versus fitted values for two models on advertising conversion.
Original model (n_clicks versus n_impressions)
Transformed model (n_clicks ^ 0.25 versus n_impressions ^ 0.25)
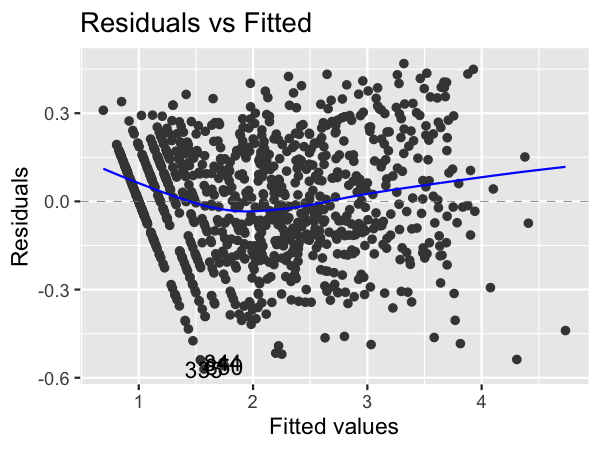
Look at the numbers on the y-axis scales, and how well the trend lines follow the \(y = 0\) line. Which statement is true?
This exercise is part of the course
Introduction to Regression in R
Hands-on interactive exercise
Turn theory into action with one of our interactive exercises
 Start Exercise