Interpretation of predictor insight graphs
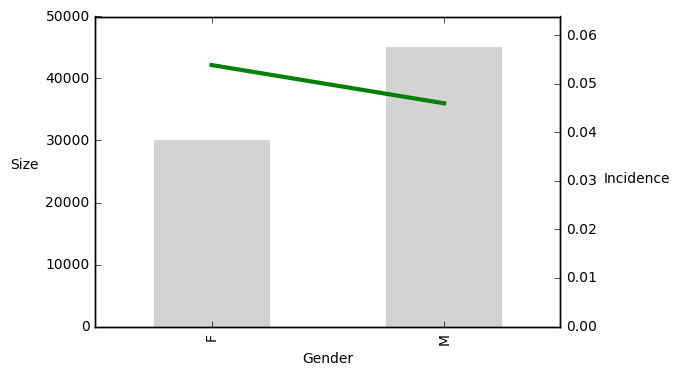
Consider the predictor insight graph that indicates the relationship between the target incidence and the gender (M - male, F - female) of the candidate donor. The bars indicate the size of the groups, the line indicates the percentage targets.
This exercise is part of the course
Introduction to Predictive Analytics in Python
Hands-on interactive exercise
Turn theory into action with one of our interactive exercises
 Start Exercise