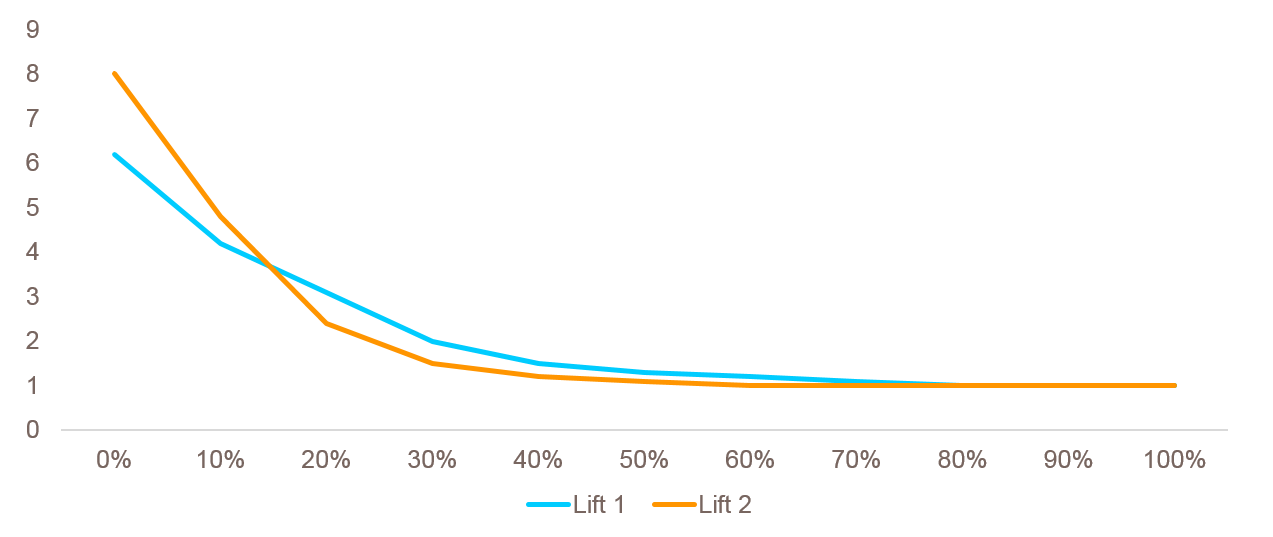
Interpreting the lift curve
Below are given the lift curves of two models that predict which donors are most likely to donate for a certain campaign. Assume that you have budget to address 20% of the donors. Which model should you use? Recall that the lift curve shows how many times more than average the model reaches targets when a given percentage of the population that is most likely to be target according to the model is considered.
This exercise is part of the course
Introduction to Predictive Analytics in Python
Hands-on interactive exercise
Turn theory into action with one of our interactive exercises
 Start Exercise