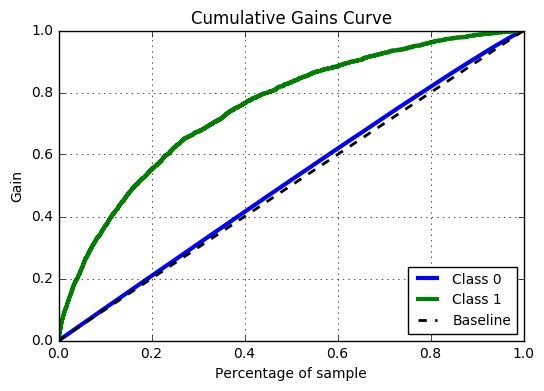
Interpreting the cumulative gains curve
You built a model to predict which donors are most likely to react on a campaign and built a cumulative gains curve plotted below. Assume you have budget to send a letter to the top 30 000 donors among the 100 000 donors. How many targets (donors that react) will you have reached, if there are 5 000 targets among the 100 000 donors? Recall that the cumulative gains curve shows for each value x on the horizontal axis the percentage targets that is reached when using the model.
This exercise is part of the course
Introduction to Predictive Analytics in Python
Hands-on interactive exercise
Turn theory into action with one of our interactive exercises
 Start Exercise