Pay Gap
The plot below shows the distribution of compensation for Active and Inactive employees at Analyst and Specialist level.
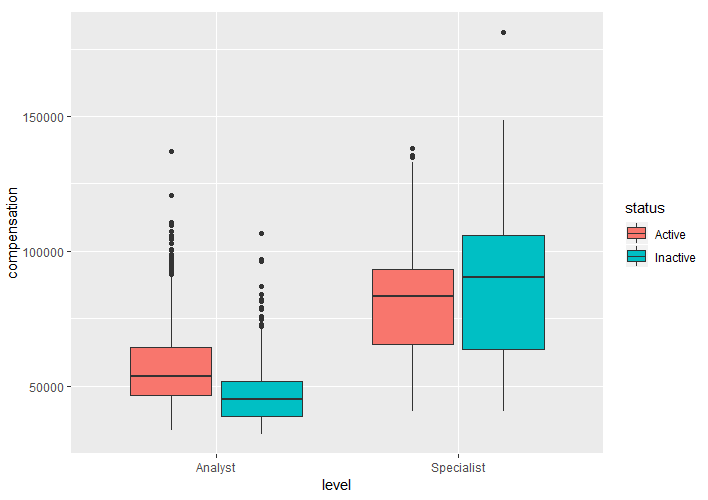
Review the plot and select the correct option below:
This exercise is part of the course
HR Analytics: Predicting Employee Churn in R
Hands-on interactive exercise
Turn theory into action with one of our interactive exercises
 Start Exercise