Aykırı değeri belirle
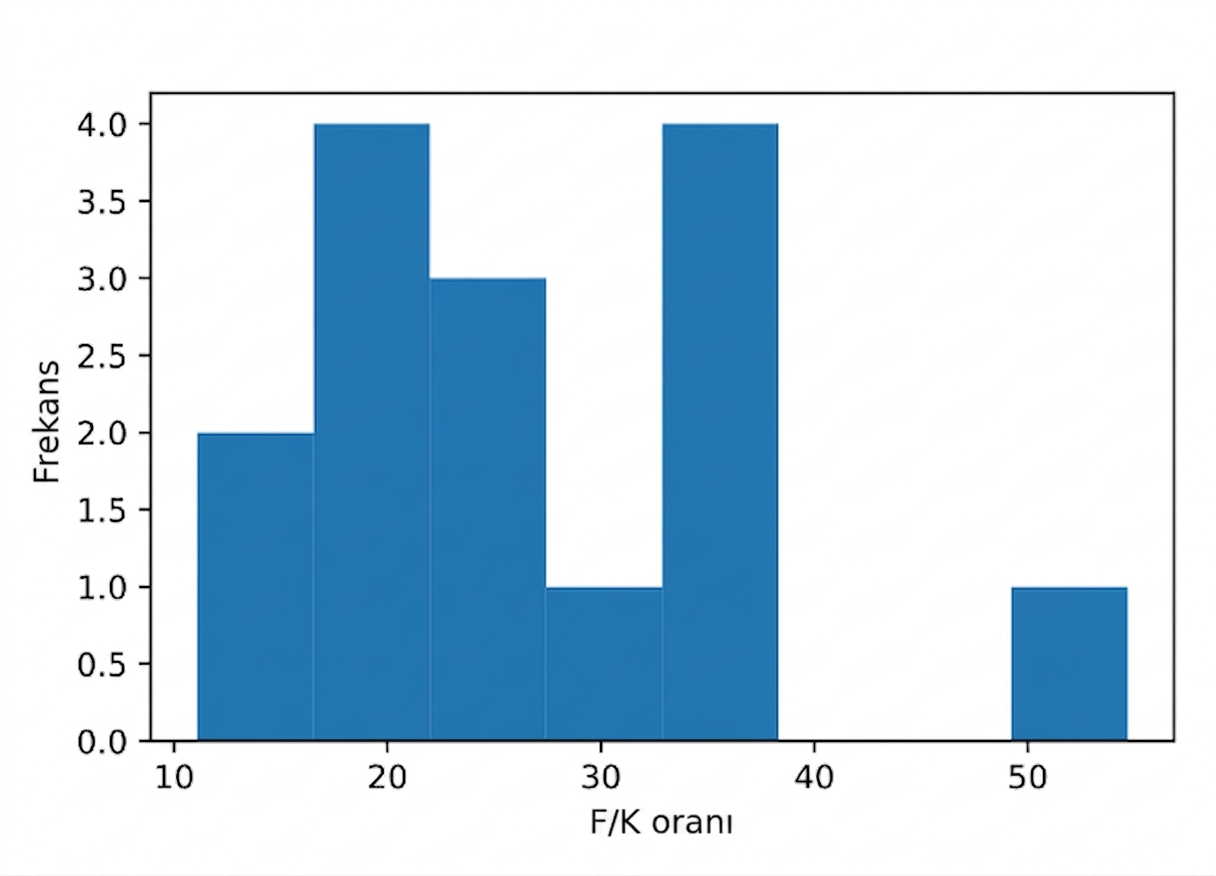
Histogramlar, aykırı değerleri veya olağandışı veri noktalarını belirlemene yardımcı olabilir. Bu histogramdaki hangi F/K oranı bir aykırı değere örnektir?
Bu egzersiz, kursun bir parçasıdır
Finans için Python’a Giriş
Uygulamalı etkileşimli egzersiz
Teoriyi etkileşime dönüştürün, interaktif egzersizlerimizden biriyle
 Egzersize başla