Kärnbomber per land
Du har fått en version av Nuclear Explosion DataBase (NEDB) där landsnamnen anges i kolumnrubrikerna (nuke_df). Målet är att visualisera hur många kärnvapenprov som genomfördes per år och land. Du behöver pivotera datan och ersätta NA-värden först.
Paketet ggplot2 har redan laddats in.
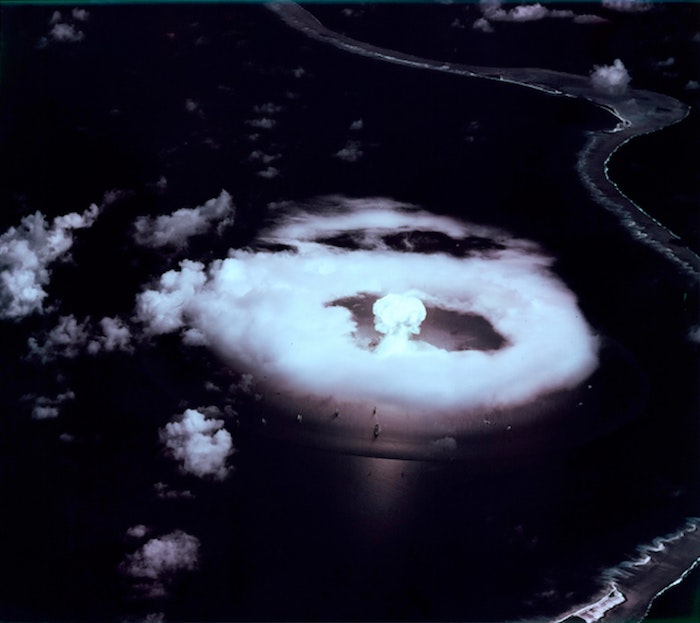
"A-Day" – Första atombombsexplosionen vid Bikini på Marshallöarna, 1 juli 1946.
Den här övningen är en del av kursen
Omforma data med tidyr
Interaktiv övning med praktiskt arbete
Testa den här övningen genom att slutföra den här exempelkoden.
nuke_df %>%
  # Pivot the data to a longer format
  ___