Otimização na Manufatura: Score & Rank
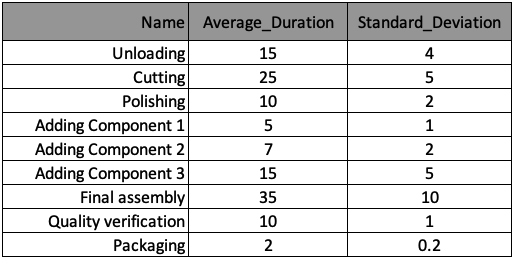
Vamos usar o mesmo modelo de eventos discretos da fábrica de relógios de parede e configurar uma rotina de otimização "Score & Rank". Para sua conveniência, o processo de manufatura está resumido novamente na tabela abaixo. As informações foram armazenadas em uma lista de dicionários chamada processes, com um dicionário por processo. As chaves desse dicionário correspondem aos cabeçalhos das colunas da tabela.
O método plot_results() usado para gerar os gráficos neste exercício já foi carregado e é mostrado abaixo.
def plot_results(objective_func):
    # Score
    fig, axes = plt.subplots(1, len(processes), sharey=True, figsize=(10, 8))
    for p in range(len(processes)):
        sns.scatterplot(ax=axes[p], x=process_duration_all[:, p], y=objective_func, c=objective_func, cmap="turbo_r")
        axes[p].set_title(processes[p]["Name"], rotation = 20, horizontalalignment='left')
        axes[p].set_xlabel("Duration [min]", rotation = -10)
        axes[p].grid()
    axes[0].set_ylabel("Objective function score")
    plt.show()

    # Rank
    index_sort = np.argsort(objective_func)
    fig, axes = plt.subplots(1, len(processes), sharey=True, figsize=(10, 8))
    for p in range(len(processes)):
        sns.lineplot(ax=axes[p], x=np.linspace(0, NUM_SIMULATIONS, NUM_SIMULATIONS),
                     y=process_duration_all[index_sort, p], color="orchid")
        axes[p].set_title(processes[p]["Name"], rotation = 20, horizontalalignment='left')
        axes[p].set_xlabel("Score-ranked scenarios", rotation = -10)
        axes[p].grid()
    axes[0].set_ylabel("Duration [min]")
    plt.show()
O loop de amostragem de Monte Carlo produzirá uma série de trajetórias de processo possíveis e as pontuará, como mostrado na figura.
Este exercicio faz parte do curso
Simulação de Eventos Discretos em Python
Instruções do exercicio
- Some a contribuição de pontuação de cada processo, sabendo que a duração dos processos está armazenada em
process_duration_all[s, p]e seus respectivos pesos emproc_p["score_weight_0_10"]. - Configure o laço for para executar
NUM_SIMULATIONSrodadas de Monte Carlo comscomo variável auxiliar. - Execute o mecanismo de Monte Carlo armazenado na função
run_monte_carlo()(isso vai gerar os gráficos de "score" e "rank")
exercicio interativo prático
Tente este exercicio completando este código de exemplo.
def objective_function_calc():
    objective_func = np.ones(NUM_SIMULATIONS)

    for s in range(NUM_SIMULATIONS):
        for p in range(len(processes)):
            proc_p = processes[p]

            # Add the score contribution of each process
            objective_func[s] += ____

    plot_results(objective_func)

def run_monte_carlo():

    # Set the for-loop to run NUM_SIMULATIONS Monte-Carlo runs
    ____

        env = simpy.Environment()
        env.process(manufractoring_process(env, s))
        env.run()

    objective_function_calc()

# Run the Monte Carlo function
____