Investigando a variável idade
Uma forma comum de investigar uma variável é contar quantas vezes valores específicos aparecem nos dados.
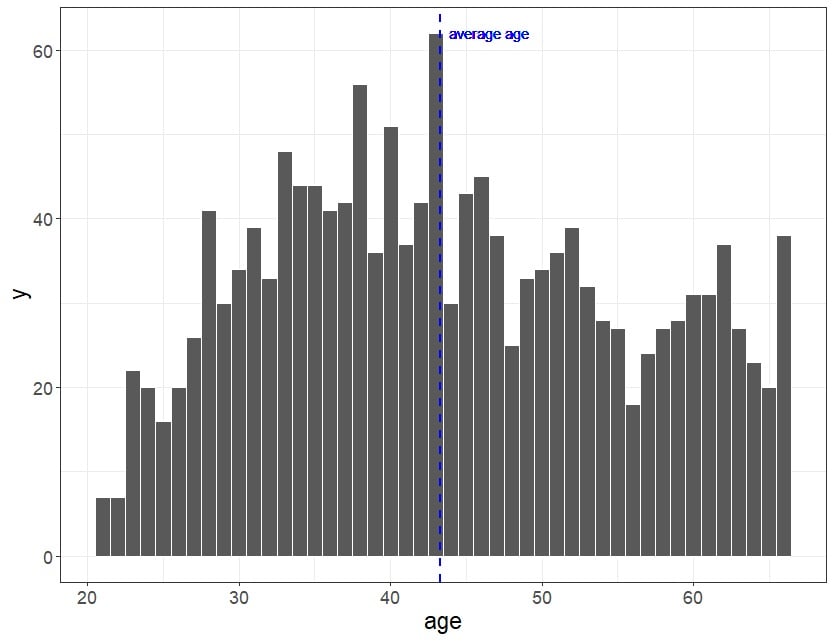
Um histograma, por exemplo, mostra as contagens para cada valor da variável. Ele é muito útil para verificar quais valores são mais comuns ou quais estão ausentes.
A pessoa cientista de dados da sua equipe preparou o histograma que você vê aqui para ajudar a avaliar quão bem diferentes idades estão representadas na pesquisa.
 Quais afirmações sobre idade são VERDADEIRAS?
Este exercicio faz parte do curso
Estudo de Caso de Letramento em Dados: Análise do Trabalho Remoto
exercicio interativo prático
Transforme teoria em prática com um dos nossos exercicio interativos
 Iniciar exercicio