Explorar culinárias: nuvens de palavras
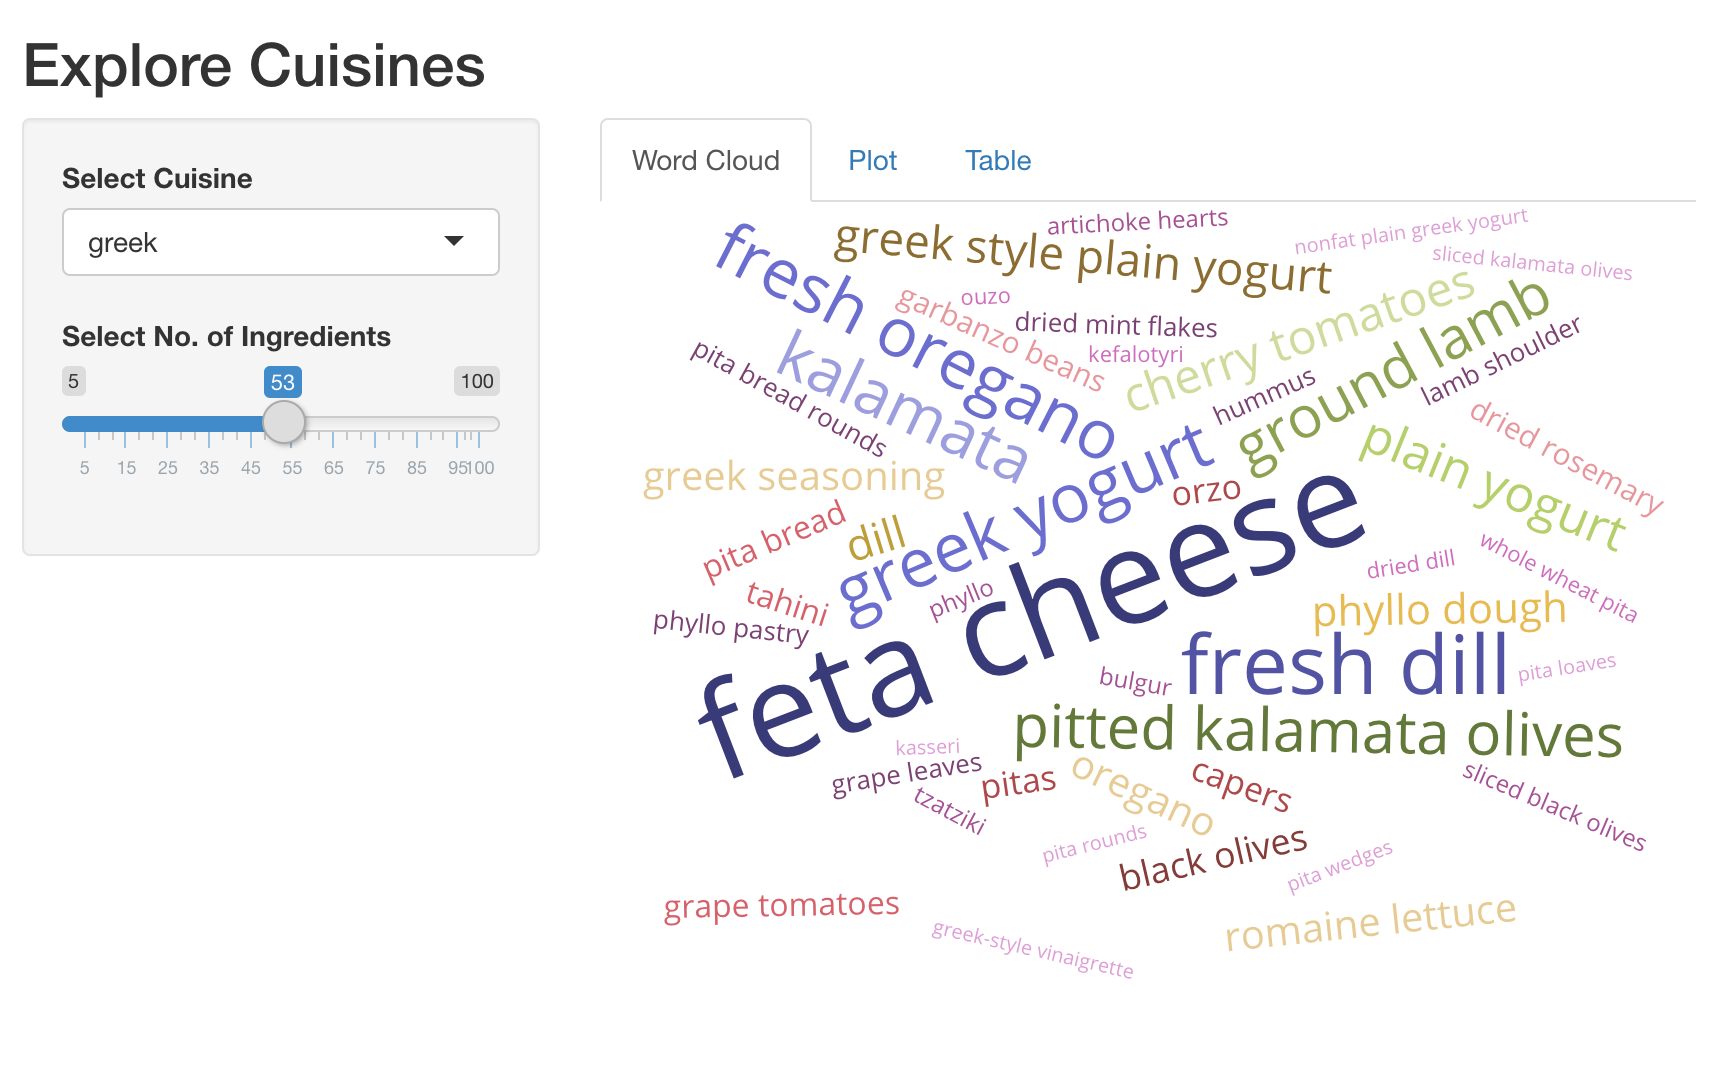
Esperamos que você esteja se divertindo ao criar estes apps Shiny sobre comida! Uma forma prática de visualizar muitos dados é usando nuvens de palavras. Neste exercício, você vai estender o app Shiny que construímos antes e adicionar uma nova aba que mostra os ingredientes mais distintivos como uma nuvem de palavras interativa.
Já carregamos os pacotes shiny, dplyr, ggplot2, plotly e
d3wordcloud. Aqui vai um trecho útil para criar uma nuvem de palavras.
d3wordcloud(
  words = c('hello', 'world', 'good'),
  freqs = c(20, 40, 30),
  tooltip = TRUE
)
Este exercicio faz parte do curso
Construindo Aplicações Web com Shiny em R
Instruções do exercicio
- UI: Adicione um
d3wordcloudOutput()chamadowc_ingredientse envolva-o em umtabPanel(). Este deve ser o primeirotabPanel()no seu app. - Server: Renderize uma nuvem de palavras interativa dos principais ingredientes e
do número de receitas em que são usados, usando
d3wordcloud::renderD3wordcloud()e atribua-a a uma saída chamadawc_ingredients. Você precisará usar a expressão reativarval_top_ingredients()para retornar um data frame com os principais ingredientes e suas contagens de receitas.
exercicio interativo prático
Tente este exercicio completando este código de exemplo.
ui <- fluidPage(
  titlePanel('Explore Cuisines'),
  sidebarLayout(
    sidebarPanel(
      selectInput('cuisine', 'Select Cuisine', unique(recipes$cuisine)),
      sliderInput('nb_ingredients', 'Select No. of Ingredients', 5, 100, 20),
    ),
    mainPanel(
      tabsetPanel(
        # CODE BELOW: Add `d3wordcloudOutput` named `wc_ingredients` in a `tabPanel`

        tabPanel('Plot', plotly::plotlyOutput('plot_top_ingredients')),
        tabPanel('Table', DT::DTOutput('dt_top_ingredients'))
      )
    )
  )
)

server <- function(input, output, session){
  # CODE BELOW: Render an interactive wordcloud of top ingredients and
  # the number of recipes they get used in, using `d3wordcloud::renderD3wordcloud`,
  # and assign it to an output named `wc_ingredients`.


  rval_top_ingredients <- reactive({
    recipes_enriched %>%
      filter(cuisine == input$cuisine) %>%
      arrange(desc(tf_idf)) %>%
      head(input$nb_ingredients) %>%
      mutate(ingredient = forcats::fct_reorder(ingredient, tf_idf))
  })
  output$plot_top_ingredients <- plotly::renderPlotly({
    rval_top_ingredients() %>%
      ggplot(aes(x = ingredient, y = tf_idf)) +
      geom_col() +
      coord_flip()
  })
  output$dt_top_ingredients <- DT::renderDT({
    recipes %>%
      filter(cuisine == input$cuisine) %>%
      count(ingredient, name = 'nb_recipes') %>%
      arrange(desc(nb_recipes)) %>%
      head(input$nb_ingredients)
  })
}

shinyApp(ui = ui, server= server)