Nu al?
Stel je het volgende scenario voor: je hebt een model getraind met een volledig jaar aan gelabelde data en dit in productie gezet.
Eén dag na de uitrol besluit je je datamonitoringdashboard te controleren, en je ziet de volgende afbeelding, waarbij de trainingsinputs blauw zijn en de productie-inputs oranje punten.
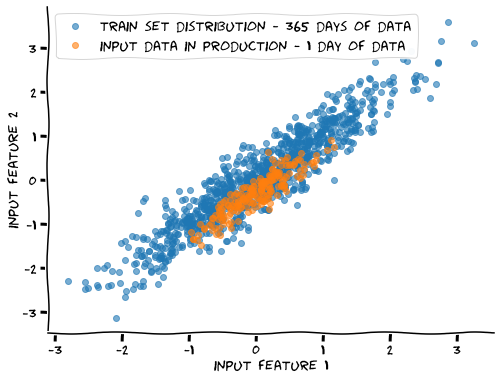
Welke conclusie kun je met zekerheid trekken?
Deze oefening maakt deel uit van de cursus
MLOps-deployments en levenscyclus
Interactieve oefening met praktijkervaring
Zet theorie om in actie met een van onze interactieve oefeningen
 Begin oefening